Are you a Quiet Speculation member?
If not, now is a perfect time to join up! Our powerful tools, breaking-news analysis, and exclusive Discord channel will make sure you stay up to date and ahead of the curve.
As regular as the inexorable advance of time, the Modern Metagame Update is here. Modern is on a bit of a downswing in May, thanks to the RCQ season being Pioneer. Again. Hopefully this fall's Modern RCQ season will see more interest and with that more data.
Here We Are Again
As has become normal in these Updates, we have statistical outliers in both datasets. However, as April established, they've changed in both scale and form from the previous normal. It used to be that UR Murktide outstripped everything else by such a wide margin that outliers were obvious, but the metagame has coalesced, and more decks are in the running.
Magic Online (MTGO) has three outliers in May: Rakdos Scam, 4-Color Creativity, and UR Murktide. As in April, the tests didn't agree with each other, but it wasn't as bad as last time. All the tests agreed that Scam was an outlier and Creativity and Murktide were right at the line. Some put only Creativity over, some had both. I have both as outliers so I can put more decks on the tier list, which is now my policy.


As for the paper results, Temur Rhinos and Murktide are the outliers this time. Both were firmly placed as oultiers by the Interquartile Range (IQR) tests, but the z-Score tests only had Rhinos, and not by much. Again, as long as one test puts a deck as an outlier, I'll count it, but even if they had to agree, the difference between the decks is so small I'd have included Murktide anyway.
As always, outliers are removed from the tier calculations, resulting in adjusted averages and standard deviations (STDevs). The decks remain in their correct place on the tier list.
May Population Metagame
To make the tier list, a given deck has to beat the overall average population for the month. The average is my estimate for how many results a given deck "should” produce in a given month. Being a tiered deck requires being better than “good enough.” Every deck that posts at least the average number of results is "good enough" and makes the tier list.
Then we go one standard deviation (STdev) above average to set the limit of Tier 3 and the cutoff for Tier 2. This mathematically defines Tier 3 as those decks clustered near the average. Tier 2 goes from the cutoff to the next standard deviation. These are decks that perform well above average. Tier 1 consists of those decks at least two standard deviations above the mean result, encompassing the truly exceptional performing decks.
The MTGO data nearly exclusively comes from official Preliminary and Challenge results. Leagues are excluded, as they are curated lists and thus invalid. The paper data comes from any source I can find, with all reported events being counted.
The MTGO Population Data
In May, the adjusted average population for MTGO was 7.19, setting the Tier 3 cutoff at seven decks. I always round down if the decimal is less than .20. Tier 3, therefore, begins with decks posting seven results. The adjusted STdev was 11.20, so add 12 and that means Tier 3 runs to 19 results. Again, it's the starting point to the cutoff, then the next whole number for the next Tier. Therefore Tier 2 starts with 20 results and runs to 32. Subsequently, to make Tier 1, 33 decks are required.

May continues the population trend from April, and was in fact far worse. January 2023 had 840 decks, February had 876, and March had a staggering 1,003 decks, April fell to 949 decks and May has plummeted to 770 decks, the lowest point of 2023. There weren't many big Preliminaries and no extra events in May thanks to the competitive focus being on Pioneer.
That said, diversity hasn't suffered. January had 74 unique decks, February had 84, and March mustered 88. April hit 82, and so did May. When the focus is away, the rogue decks come out to play, it would seem. They couldn't sustain that diversity into the tier list, though. Of the 82 decks, only 22 made the population tier, down from April's 29 and even March's 25.
| Deck Name | Total # | Total % |
|---|---|---|
| Tier 1 | ||
| Rakdos Scam | 71 | 9.22 |
| 4-Color Creativity | 69 | 8.96 |
| UR Murktide | 62 | 8.05 |
| Hammer Time | 50 | 6.49 |
| Temur Rhinos | 49 | 6.36 |
| Living End | 45 | 5.84 |
| Mono-Green Tron | 35 | 4.54 |
| Burn | 33 | 4.29 |
| Tier 2 | ||
| Yawgmoth | 31 | 4.03 |
| Hardened Scales | 27 | 3.51 |
| Jeskai Value Breach | 26 | 3.38 |
| Counter Cat | 20 | 2.60 |
| Tier 3 | ||
| Jund Creativity | 17 | 2.21 |
| Amulet Titan | 16 | 2.08 |
| 4-Color Control | 13 | 1.69 |
| UW Control | 12 | 1.56 |
| Temur Creativity | 11 | 1.43 |
| Coffers | 11 | 1.43 |
| Izzet Prowess | 11 | 1.43 |
| Affinity | 9 | 1.17 |
| Mill | 7 | 0.91 |
| 4-Color Elementals | 7 | 0.91 |

Scam sits atop the list for I think the first time ever. Creativity was leading for most of the month, but Scam enjoyed a strong push at the end of the May, sending it over the top. Murktide again had to make up a lot of ground after the first week, and almost did it again, but Scam's push apparently derailed it.
Living End being the 6th-place deck is slightly misleading. It achieved that position thanks primarily to an incredible first week of May, and then steadily lost ground as the month wore on. I suspect that it took advantage of players forgetting their graveyard hate one weekend, and once everyone remembered, it lost its moment.
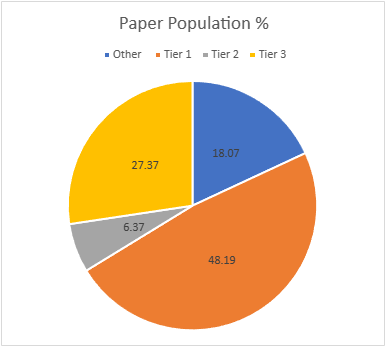
The Paper Population Data
The paper tiers are calculated the same way as the MTGO tiers, just with different data. In most months there are far more reported paper events than online, but paper also tends to report fewer results per event. It's quite annoying, but paper events rarely report more than the Top 8, and far too often for my purposes, only the Top 4. This makes the paper data far more variable than MTGO.
January saw 667 decks, February is up to 807, March hit 962, April plunged to 551, and May was slightly up to 581. There were about the same number of events as April, but they reported more complete data and it was also uploaded in a timelier manner. Kudos, tournament organizers!

Paper events often report the actual records alongside decklists. Thus, I've decided to change how I record decks when win rates are available. For smaller events, I take any winning record which sometimes means I don't include the full Top 8. For larger events, I'm taking the Top 32 and all the decks with the same record as 32nd place. Tiebreakers are a strange and mysterious alchemy, after all, and may benefit or screw players on a whim.
With more results came a more diverse data set. January had 101 decks, February 108, March just 103, April down to 89, and May was up to 102. 29 decks made the tier list, which is what I expect from paper. The adjusted average population was 4.92, so five decks make Tier 3. The adjusted STDev was 8.22, so the increment is 9. Therefore, Tier 3 runs from 5 to 14, Tier 2 is 15 to 24, and Tier 1 is 25 and over.
| Deck Name | Total # | Total % |
|---|---|---|
| Tier 1 | ||
| Temur Rhinos | 53 | 9.12 |
| UR Murktide | 51 | 8.78 |
| 4-Color Creativity | 47 | 8.09 |
| Hammer Time | 41 | 7.06 |
| Amulet Titan | 32 | 5.51 |
| Rakdos Scam | 31 | 5.34 |
| Living End | 25 | 4.30 |
| Tier 2 | ||
| Burn | 21 | 3.61 |
| Mono-Green Tron | 16 | 2.76 |
| Tier 3 | ||
| Merfolk | 13 | 2.24 |
| Yawgmoth | 13 | 2.24 |
| 4-Color Elementals | 13 | 2.24 |
| Hardened Scales | 12 | 2.06 |
| UW Control | 10 | 1.72 |
| Counter Cat | 10 | 1.72 |
| Mill | 8 | 1.38 |
| Jeskai Value Breach | 8 | 1.38 |
| Izzet Prowess | 7 | 1.20 |
| Mono-Blue Tron | 7 | 1.20 |
| Goryo's Kitchen | 7 | 1.20 |
| Affinity | 7 | 1.20 |
| 4-Color Blink | 7 | 1.20 |
| Jeskai Combo Breach | 6 | 1.03 |
| Goblins | 6 | 1.03 |
| Coffers | 5 | 0.86 |
| Jund Saga | 5 | 0.86 |
| Tameshi Bloom | 5 | 0.86 |
| 4-Color Control | 5 | 0.86 |
| Jeskai Storm Breach | 5 | 0.86 |
Temur Rhinos is on top thanks to a single event. Rhinos was ridiculously overrepresented at the NRG 5K Trial, with roughly a quarter of the total decks I collected being Rhinos. That shot it up from the middle of the pack to the top where it just barely held off Murktide's consistency to win.
Note: the lack of an appreciable Tier 2 is a bad sign for the metagame's health.
March Power Metagame
Tracking the metagame in terms of population is standard practice. But how do results actually factor in? Better decks should also have better results. In an effort to measure this, I use a power ranking system in addition to the prevalence list. By doing so, I measure the relative strengths of each deck within the metagame.

The population method gives a deck that consistently just squeaks into the Top 32 the same weight as one that Top 8's. Using a power ranking rewards good results and moves the winningest decks to the top of the pile and better reflects their metagame potential.
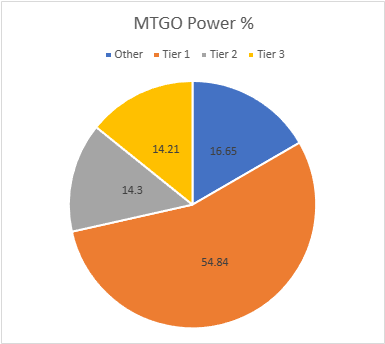
The MTGO Power Tiers
For the MTGO data, points are awarded based on the population of the event. Preliminaries award points based on record (1 for 3 wins, 2 for 4 wins, 3 for 5), and Challenges are scored 3 points for the Top 8, 2 for Top 16, and 1 for Top 32. If I can find them, non-Wizards events will be awarded points the same as Challenges or Preliminaries depending on what the event in question reports/behaves like. Super Qualifiers and similar higher-level events get an extra point and so do other events if they’re over 200 players, with a fifth point for going over 400 players. No event awarded more than 3 points in May.
Total points fell just like the population, from 1477 to 1189. The adjusted average points were 10.97, therefore 11 points made Tier 3. The adjusted STDev was 17.79. Add 18 to the starting point and Tier 3 runs to 29 points. Tier 2 starts with 30 points and runs to 48. Tier 1 requires at least 49 points.
Mill fell off the tier list and was not replaced. The MTGO metagame is a narrow and unforgiving place.
| Deck Name | Total Points | Total % |
|---|---|---|
| Tier 1 | ||
| Rakdos Scam | 109 | 9.17 |
| 4-Color Creativity | 109 | 9.17 |
| UR Murktide | 104 | 8.75 |
| Temur Rhinos | 80 | 6.73 |
| Hammer Time | 72 | 6.06 |
| Living End | 72 | 6.06 |
| Mono-Green Tron | 55 | 4.63 |
| Burn | 51 | 4.29 |
| Tier 2 | ||
| Hardened Scales | 48 | 4.04 |
| Yawgmoth | 46 | 3.87 |
| Jeskai Value Breach | 43 | 3.62 |
| Counter Cat | 33 | 2.77 |
| Tier 3 | ||
| Jund Creativity | 28 | 2.35 |
| Amulet Titan | 25 | 2.10 |
| 4-Color Control | 24 | 2.02 |
| Coffers | 20 | 1.68 |
| Temur Creativity | 19 | 1.60 |
| UW Control | 15 | 1.26 |
| Izzet Prowess | 15 | 1.26 |
| Affinity | 12 | 1.01 |
| 4-Color Elementals | 11 | 0.92 |
There's some minor reshuffling within the tiers, but other than that no movement. That's just how MTGO does it.
The Paper Power Tiers
Due to paper reporting being inconsistent compared to MTGO, I have to adapt how the points work. Applying the MTGO point system just doesn't work when I don't know how many points to award and there are data gaps. Thus, I award points based on the size of the tournament rather than placement. That way, I'm being internally consistent with the paper results.
For events with no reported starting population and those up to 32 players, one point is awarded. Events with 33 players up to 128 players gets two points. From 129 players up to 512 players gets three. Above 512 is four points, and five points will be reserved for Modern Pro Tours if they ever happen again.
Thanks to the aforementioned reporting improvement, May's points are up. January had 1178 points, February hit 1316, and March shot to 1890, April fell to 964, and May is up to 1098. The adjusted average points were 9.03, setting the cutoff at 9 decks. The STDev was 16.01, thus adding 16 to the starting point and Tier 3 runs to 25 points. Tier 2 starts with 26 points and runs to 42. Tier 1 requires at least 43 points. The total decks fell to 26, though a number of decks fell off while Jund Creativity and Humans made it in.
| Deck Name | Total Points | Total % |
|---|---|---|
| Tier 1 | ||
| Temur Rhinos | 108 | 9.84 |
| UR Murktide | 108 | 9.84 |
| 4-Color Creativity | 94 | 8.56 |
| Hammer Time | 76 | 6.92 |
| Amulet Titan | 59 | 5.37 |
| Rakdos Scam | 57 | 5.19 |
| Living End | 56 | 5.10 |
| Tier 2 | ||
| Burn | 38 | 3.46 |
| Mono-Green Tron | 31 | 2.82 |
| Yawgmoth | 26 | 2.37 |
| 4-Color Elementals | 26 | 2.37 |
| Tier 3 | ||
| Counter Cat | 23 | 2.09 |
| Merfolk | 21 | 1.91 |
| Hardened Scales | 21 | 1.91 |
| UW Control | 20 | 1.82 |
| 4-Color Blink | 17 | 1.55 |
| Jeskai Value Breach | 16 | 1.46 |
| Mill | 15 | 1.37 |
| Izzet Prowess | 13 | 1.18 |
| Goryo's Kitchen | 11 | 1.00 |
| Affinity | 11 | 1.00 |
| Tameshi Bloom | 11 | 1.00 |
| Mono-Blue Tron | 10 | 0.91 |
| Jund Creativity | 10 | 0.91 |
| 4-Color Control | 9 | 0.82 |
| Humans | 9 | 0.82 |
Tier 2 looks a bit better here, but it's still not a great distribution. Murktide and Rhinos are tied for first. I left them in the same position so that I can say that Tier 1 is completely unchanged.
Average Power Rankings
Finally, we come to the average power rankings. These are found by taking the total points earned and dividing them by total decks, to measure points per deck. I use this to measure strength vs. popularity. Measuring deck strength is hard. There is no Wins-Above-Replacement metric for Magic, and I'm not certain that one could be credibly devised. The game is too complex, and even then, power is very contextual.
Using the power rankings certainly helps and serves to show how justified a deck’s popularity is. However, more popular decks will still necessarily earn a lot of points. Therefore, the top tier doesn't move much between population and power, and obscures whether its decks really earned their position.

This is where the averaging comes in. Decks that earn a lot of points because they get a lot of results will do worse than decks that win more events, indicating which deck actually performs better.
A higher average indicates lots of high finishes, whereas low averages result from mediocre performances and a high population. Lower-tier decks typically do very well here, likely due to their pilots being enthusiasts. Bear this in mind and be careful about reading too much into these results. However, as a general rule, decks which place above the baseline average are over-performing, and vice versa.
How far above or below that average a deck sits justifies its position on the power tiers. Decks well above baseline are undervalued, while decks well below baseline are very popular, but aren't necessarily good.
The Real Story
When considering the average points, the key is looking at how far off a deck is from the Baseline stat (the overall average of points/population). The closer a deck’s performance to the Baseline, the more likely it is to be performing close to its “true” potential.
A deck that is exactly average would therefore perform exactly as well as expected. The greater the deviation from the average, the more a deck under or over-performs. On the low end, a deck’s placing was mainly due to population rather than power, which suggests it’s overrated. A high-scoring deck is the opposite of this.
I'll begin with the averages for MTGO:
| Deck Name | Average Points | Power Tier |
|---|---|---|
| 4-Color Control | 1.84 | 3 |
| Coffers | 1.82 | 3 |
| Hardened Scales | 1.78 | 2 |
| Temur Creativity | 1.72 | 3 |
| UR Murktide | 1.68 | 1 |
| Jeskai Value Breach | 1.65 | 2 |
| Counter Cat | 1.65 | 2 |
| Jund Creativity | 1.65 | 3 |
| Temur Rhinos | 1.63 | 1 |
| Living End | 1.60 | 1 |
| 4-Color Creativity | 1.58 | 1 |
| Mono-Green Tron | 1.57 | 1 |
| 4-Color Elementals | 1.57 | 3 |
| Amulet Titan | 1.56 | 3 |
| Burn | 1.55 | 1 |
| Rakdos Scam | 1.53 | 1 |
| Yawgmoth | 1.48 | 2 |
| Hammer Time | 1.44 | 1 |
| Baseline | 1.42 | |
| Izzet Prowess | 1.36 | 3 |
| Affinity | 1.33 | 3 |
| UW Control | 1.25 | 3 |
Congratulation to Murktide. As the highest placing Tier 1 deck, you're May's MTGO Deck of the Month! Apparently, you being an outlier really is correct.
Now the paper averages:
| Deck Name | Average Points | Power Tier |
|---|---|---|
| Jund Creativity | 2.50 | 3 |
| 4-Color Blink | 2.43 | 3 |
| Counter Cat | 2.30 | 3 |
| Humans | 2.25 | 3 |
| Living End | 2.24 | 1 |
| Tameshi Bloom | 2.20 | 3 |
| UR Murktide | 2.11 | 1 |
| Temur Rhinos | 2.04 | 1 |
| 4-Color Creativity | 2.00 | 1 |
| Yawgmoth | 2.00 | 2 |
| 4-Color Elementals | 2.00 | 2 |
| UW Control | 2.00 | 3 |
| Jeskai Value Breach | 2.00 | 3 |
| Mono-Green Tron | 1.94 | 2 |
| Mill | 1.88 | 3 |
| Izzet Prowess | 1.86 | 3 |
| Hammer Time | 1.85 | 1 |
| Amulet Titan | 1.84 | 1 |
| Rakdos Scam | 1.84 | 1 |
| Burn | 1.81 | 2 |
| 4-Color Control | 1.80 | 3 |
| Hardened Scales | 1.75 | 3 |
| Baseline | 1.74 | |
| Merfolk | 1.61 | 3 |
| Goryo's Kitchen | 1.57 | 3 |
| Affinity | 1.57 | 3 |
| Mono-Blue Tron | 1.43 | 3 |
Alright, Living End. You seem to be Deck of the Month every time you make Tier 1. Players need to be better about consistently answering you.
Composite Metagame
That's a lot of data, but what does it all mean? When Modern Nexus was first started, we had a statistical method to combine the MTGO and paper data, but the math of that system doesn't work without big paper events. I tried. Instead, I'm using an averaging system to combine the data. I take the MTGO results and average the tier, then separately average the paper results, then average the paper and MTGO results together for final tier placement.
This generates a lot of partial Tiers. That's not a bug, but a feature. The nuance separates the solidly Tiered decks from the more flexible ones and shows the true relative power differences between the decks. Every deck in the paper and MTGO results is on the table, and when they don't appear in a given category, they're marked N/A. This is treated as a 4 for averaging purposes.
| Deck Name | MTGO Pop Tier | MTGO Power Tier | MTGO AverageTier | Paper Pop Tier | Paper Power Tier | Paper Average Tier | Composite Tier |
|---|---|---|---|---|---|---|---|
| Rakdos Scam | 1 | 1 | 1 | 1 | 1 | 1 | 1.00 |
| 4-Color Creativity | 1 | 1 | 1 | 1 | 1 | 1 | 1.00 |
| UR Murktide | 1 | 1 | 1 | 1 | 1 | 1 | 1.00 |
| Hammer Time | 1 | 1 | 1 | 1 | 1 | 1 | 1.00 |
| Temur Rhinos | 1 | 1 | 1 | 1 | 1 | 1 | 1.00 |
| Living End | 1 | 1 | 1 | 1 | 1 | 1 | 1.00 |
| Mono-Green Tron | 1 | 1 | 1 | 2 | 2 | 2 | 1.50 |
| Burn | 1 | 1 | 1 | 2 | 2 | 2 | 1.50 |
| Amulet Titan | 3 | 3 | 3 | 1 | 1 | 1 | 2.00 |
| Yawgmoth | 2 | 2 | 2 | 3 | 2 | 2.5 | 2.25 |
| Hardened Scales | 2 | 2 | 2 | 3 | 3 | 3 | 2.50/strong> |
| Counter Cat | 2 | 2 | 2 | 3 | 3 | 3 | 2.50/strong> |
| Jeskai Value Breach | 2 | 2 | 2 | 3 | 3 | 3 | 2.50 |
| 4-Color Elementals | 3 | 3 | 3 | 3 | 2 | 2.5 | 2.75 |
| 4-Color Control | 3 | 3 | 3 | 3 | 3 | 3 | 3.00 |
| UW Control | 3 | 3 | 3 | 3 | 3 | 3 | 3.00 |
| Izzet Prowess | 3 | 3 | 3 | 3 | 3 | 3 | 3.00 |
| Affinity | 3 | 3 | 3 | 3 | 3 | 3 | 3.00 |
| Jund Creativity | 3 | 3 | 3 | N/A | 3 | 3.5 | 3.25 |
| Coffers | 3 | 3 | 3 | 3 | N/A | 3.5 | 3.25 |
| Mill | 3 | N/A | 3.5 | 3 | 3 | 3 | 3.25 |
| Temur Creativity | 3 | 3 | 3 | N/A | N/A | N/A | 3.50 |
| Merfolk | N/A | N/A | N/A | 3 | 3 | 3 | 3.50 |
| Mono-Blue Tron | N/A | N/A | N/A | 3 | 3 | 3 | 3.50 |
| Goryo's Kitchen | N/A | N/A | N/A | 3 | 3 | 3 | 3.50 |
| 4-Color Blink | N/A | N/A | N/A | 3 | 3 | 3 | 3.50 |
| Tameshi Bloom | N/A | N/A | N/A | 3 | 3 | 3 | 3.50 |
| Jeskai Storm Breach | N/A | N/A | N/A | 3 | N/A | 3.5 | 3.75/strong> |
| Jeskai Combo Breach | N/A | N/A | N/A | 3 | N/A | 3.5 | 3.75 |
| Goblins | N/A | N/A | N/A | 3 | N/A | 3.5 | 3.75 |
| Jund Saga | N/A | N/A | N/A | 3 | N/A | 3.5 | 3.75 |
| Humans | N/A | N/A | N/A | N/A | 3 | 3.5 | 3.75 |
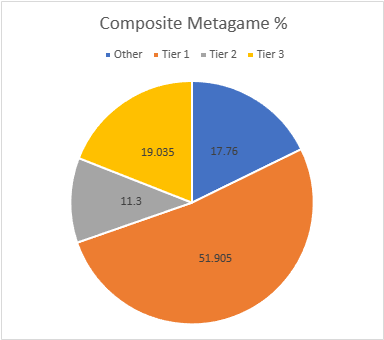
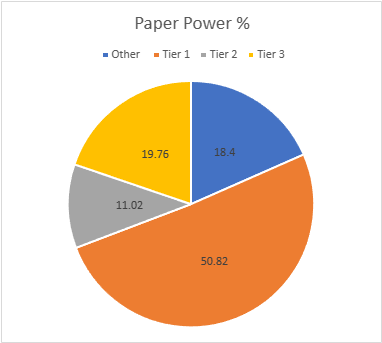
Overall concentration in Tier 1 is up by almost 4%. I'll have a lot to say about this situation in the analysis article Friday.
Keeping On, Keeping On
As the Lord of the Rings set looks to have a minimal impact on Modern, the status quo will almost certainly sustain itself in June. It's looking like the only chance for a major shakeup will be the August 7 potential ban(s). However, there's always a chance for surprises.
