Are you a Quiet Speculation member?
If not, now is a perfect time to join up! Our powerful tools, breaking-news analysis, and exclusive Discord channel will make sure you stay up to date and ahead of the curve.
365 days of live and fully transparent MTGO speculations are over! 2015 is gone and with it the "100 Tix, 1 Year" project is now complete. Welcome back for the concluding article of our journey.
First and foremost, thanks to all of you for following, commenting and being part of this adventure. I can’t believe one year has already passed since the first article. I hope you've also been able to enjoy the Nine Months of Portfolio Management series which followed a similar model.
One year ago, I had just opened a fresh new account with only 100 tix on it, with the goal to make as many tix as I could while publishing every single speculative move. I was fairly confident the account would post more tix on January 1st, 2016 than a year before, but I was not exactly sure how things would unfold. I was expecting to be somewhere around 300 to 400 tix today. It ended up being a little more than that…
The final number of tix on the account at the end of the year is one matter. How I got there is also valuable information. Today I’ll review the whole project with data and numbers extracted from my specs, and comment on some aspects I found salient.
The Final Result
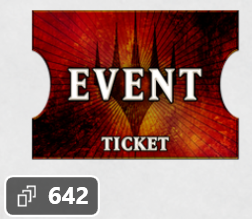
You may have seen my tweet on January 1st. If not, here is the official, final value of the "100 Tix, 1 Year" account!
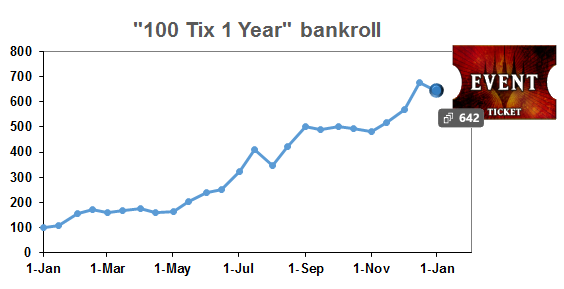
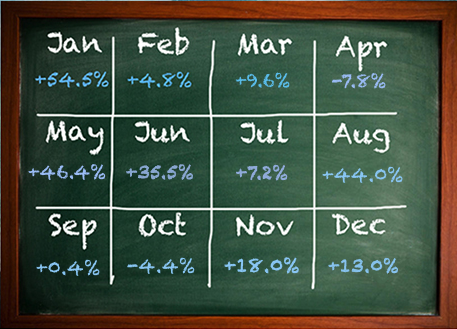
The bankroll grew by 13% in the final month of December to finish at a whopping 642 tix after 365 days! This is clearly higher than I anticipated.
Here's a summary of the month-by-month bankroll evolution during 2015.
With his guess of 650 tix, Bertrand Lamarre is the grand winner of the one -ear guess contest. Since I made a mistake when I announced the result for the six-month guess contest I’ll wait one week from today before awarding Bertrand his prize to see if anyone comes forward to point out any errors. You can check your guess here and/or contest the result if needed.
100 Tix, 1 Year in Numbers and Graphs
With more than 632 Twitter followers and 100 tweets, the "100 Tix, 1 Year" was a successful venture for me on social media.
All of speculative moves made with the account were and are still available on Twitter. You could actually go through and recreate the evolution of my portfolio from scratch by adding up the gains and losses reported after each sale. This would probably yield a slightly higher value than 642 tix, considering the bot credits I was not able to recover.
The data and numbers I discuss below are extracted from purchases, sales, dates and account valuation reported on the monthly reports published here at QS. A copy of the spreadsheet I used to track my specs is also available.
141 Speculative Positions
Excluding "real" quick flips and short sales I speculated on 141 positions this past year. This number includes a few positions I targeted more than once, such as Spell Snare and Sunscape Familiar. If the opportunity presents itself there's no reason not to target the same position several times.
More than half of these positions were Modern targets---86 positions or 61% of my portfolio. Modern specs are by far the most reliable and profitable opportunities available on MTGO. Watching out for reprints and flashback drafts are the only two things to worry about with Modern specs. The metagame is diverse and balanced enough that everything goes up and down in turns.
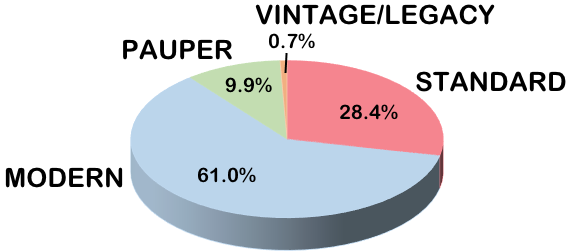 40 positions were in Standard---28% of the 141 positions. Standard can sometimes yield great results but is unfortunately far less predictable. Magic Origins (ORI) clearly hasn't paid off here but should improve this coming Spring.
14 Pauper positions---10% of the total---were part of this portfolio. They were perfectly suited for this project as they yielded great returns with a fast turnover. In retrospect I probably should have focused more on that format. Lastly, I had no intention to speculate with Legacy or Vintage positions; Terminus was the only target in these two formats.
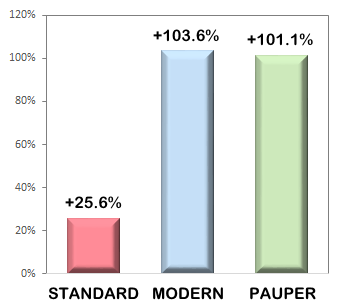
25.6%, 103.6% and 101.1%
These are the average percentage gains by format (Standard, Modern and Pauper, respectively).
Even if ORI positions had performed better, or if I had sold my Standard positions with better timing, Modern and Pauper positions were clearly more profitable. Once again, what makes the strength of Modern or Pauper specs is their cyclical aspect. Predictable cycles make it easier to buy and sell closer to the optimal price and at the right time, leading to better and more consistent profit.
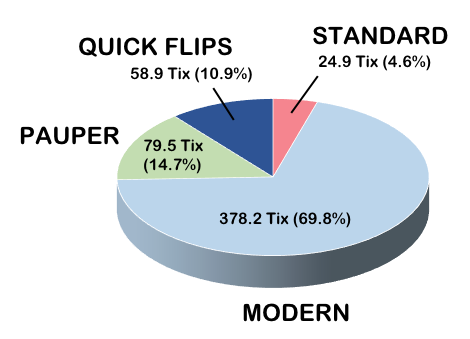
24.9 Tix, 378.2 Tix and 79.5 Tix
These are the accumulated tix gains by format (Standard, Modern and Pauper).
With only about twice as many positions compared to Standard, my Modern picks made over ten times more, generating almost 70% of the tix gained during the project. In comparison, my Standard picks represented 28% of my choices for only a very slim 4.6% of the total returns.
Another interesting number here is the number of tix accumulated through quick flips and short sales (58.9 tix), which represents more than 10% of my total gains. Some quick flips only made a few cents of tix and others way more, such as the 12 tix collected quick-flipping Mystic Gate. Quick flips should not constitute a long-term strategy by themselves but they can add a few extra tix to any bankroll with virtually no risks.
75% Winners, 25% Losers
75.18% and 24.82% to be more accurate. More than three quarters of my specs generated a profit and only a quarter of them ended up costing me. These numbers are slightly worse than those I had after 6 months but in my experience 70% or more of your positions yielding a profit is a great rate.
+80.31% Gain on Average per Position
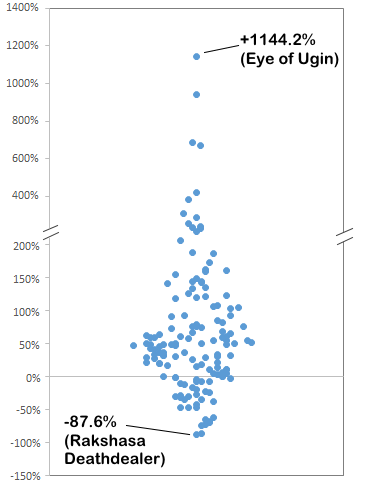
+80.31% is the average gain across the 141 positions mentioned above. The percentage gains ranked from -87.58% (Rakshasa Deathdealer) to +1,144.23% (Eye of Ugin). If the average gain per position looks impressive, it's mostly the result of speculating with cheap or bulk cards. Even with a bigger spread that can eat some of the potential profit, cheap cards tend to be more volatile---doubling or tripling on bulk or near-bulk specs is common practice.
As you speculate with more expensive cards the average gain per position tends to be lower but results in more tix (assuming you pick correctly) since the total value is higher.
If the winning positions alone are taken into account the average percentage gain is +117.8%, while the average percentage loss among the losing positions is -33.4%.
+3.41 Tix Gain on Average per Position
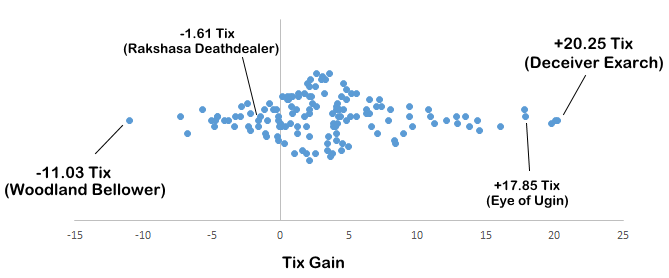
Tix-wise, the average gain among the 141 non-quick flip speculative targets of the "100 Tix, 1 Year" account was +3.41 tix. Here, the spec that cost me the most was Woodland Bellower. The green ORI mythic reduced my bankroll size by 11.03 Tix. On the other hand, my biggest winner was Deceiver Exarch with a profit of 20.25 Tix.
Seen from this angle Rakshasa Deathdealer doesn't appear so bad with a loss of only 1.61 tix. The loss only looks minimal because it was a bulk card spec. Eye of Ugin, a bulk card spec as well, nonetheless ranked third among my biggest gainers.
One interesting stat to consider when looking at the average tix gain is the ratio of total tix gained to tix invested across all positions. For the non-quick flip specs, there were 483.1 tix gained for 1,053.8 tix invested, resulting in a return of 0.458 tix for each ticket spent.
79 Days
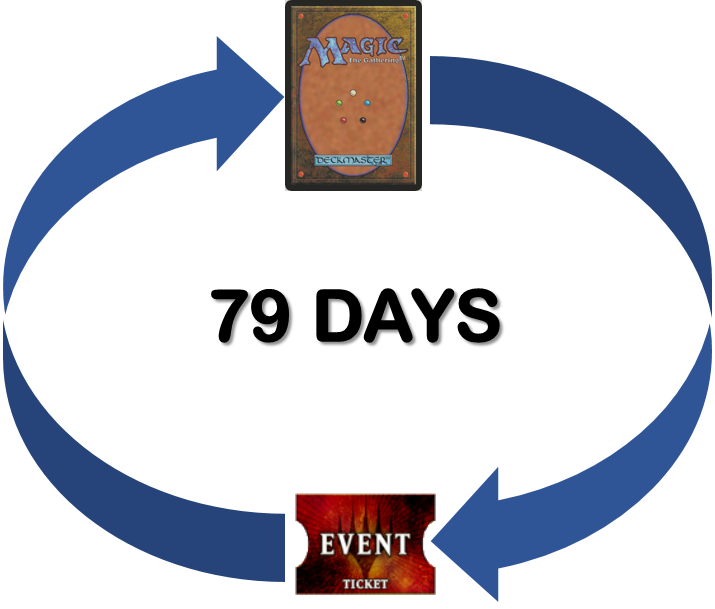
That's the average time I held any position in the "100 Tix, 1 Year" portfolio. Percentage and tix profit are two important parameters that measure the success of MTGO speculations. The turnover of your positions is a critical third factor that contributes to growing a bankroll.
Provided the percentage/tix gains remain similar, a faster turnover yields more absolute profits. +500% every six months is indeed far less efficient than +20% every week, which corresponds to more than +1,500% after six months.
For the "100 Tix, 1 Year" project I held my positions for an average time of 79 days, ranging from as little as three days (Spell Snare) to more than eight months (Ghastly Conscription).
This means the average turnover for my positions was less than three months for an average profit of +80.31%. As opposed to waiting to maximize every bit of each spec, a rapid turnover is, in my opinion, a good strategy to effectively grow a bankroll. You should not necessarily seek to sell everything as soon as it becomes profitable, but this should be a factor to consider when pondering whether or not to sell a position.
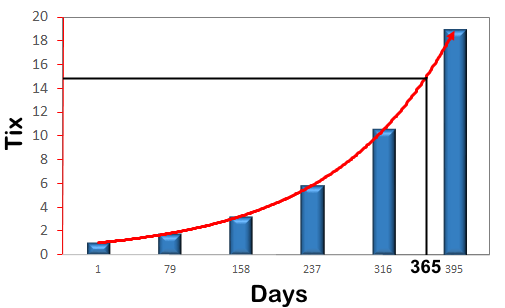
Ideally, with the parameters mentioned above and in the hypothetical case where each ticket is immediately reinvested, one ticket invested on Day 1 would generate somewhere around 14 tix after one year---a gain of 1,300% after four and half leaps of 80%.
2.85%, The Average Size of Any Position in my Portfolio
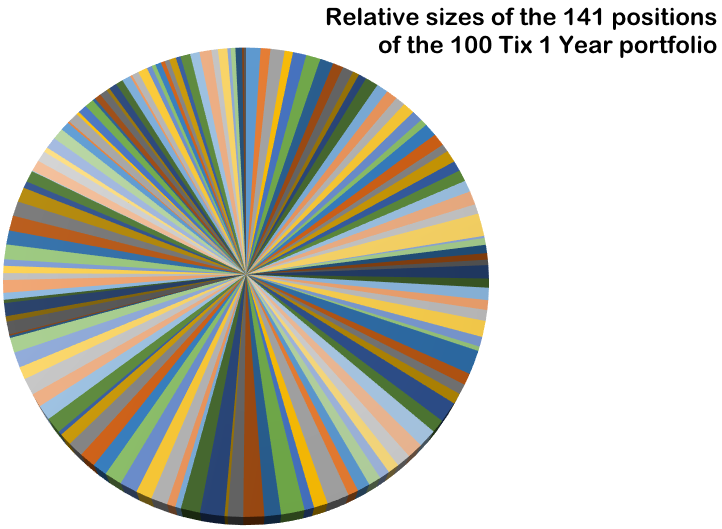
To get to this number I calculated the size of each position relative to the size of my bankroll at the time of investment. When averaged, the size of any position in my portfolio was 2.85%. What is also important (illustrated below) is that the relative sizes of all my positions were very similar.
Each color of this pie represents one position. Positions purchased within the first months involved fewer tix on average than positions purchased towards the end of the project, but their share relative to the bankroll size was a fairly constant number---2.85% on average.
Garza's Assassin, a position that ended up negative, was the largest relative position in my bankroll, representing 6.57% of the total bankroll at the time of purchase.
Only a few positions, including Threads of Disloyalty, Monastery Mentor and Karn Liberated, represented more than 5% of my bankroll at time of purchase. All these positions were purchased during the first six months of the project, when the bankroll was smaller and when it was easier to reach this 5% bar. Keeping a diversified portfolio is an essential tool for constant and lasting success.
12 Tix Worth of Bot Credits
In a previous article I reported somewhere around 7 tix in credits spread out among different bot chains. It turned out to be a little more than that.
Scrapping to get back bot credits is something speculators shouldn't really concern themselves with, unless they intend to quit MTGO. These ongoing credits are used as you come and go to buy and sell cards. But since I wanted to close the "100 Tix, 1 Year" account I needed to get back as many bot credits as possible.
Overall, I was able to scrape 12 full tix off the different bots I used. Considering this left only about 1 tix total across all the bot chains, I figured it was a pretty good recovery rate. Many of these tix were on MtgoLibrary Bots with others on MtgoTraders, GoatBots, DojoTrade and ClanTeam bots.
The strategy was fairly simple but a little tedious---I gathered cards towards bots with more leftover credits and bought more cards. One tool I used was to scour MTGO Traders' Hot List for cheap cards, e.g. under 1 tix and mostly under 0.1 tix. I then bought these cards from bots I still had credits with.
Closing Thoughts
The bankroll activity was geared towards Modern since the beginning. And Modern positions really were the main contributor to the growth of the account. The fact that Modern shined so much is also due to Standard specs yielding poor returns, particularly the Magic Origins ones.
Some of the reasons for these poor performances are my fault---I missed several selling opportunities. Siege Rhino, to start with, posted prices higher than my buying price for many months. I could have even doubled up at some point. In October, its price started declining and never stopped since. I finally sold it with a 47% loss after 253 days, a real waste of time and tix.
A few ORI positions ended up higher than when I bought them; I should have made much more on Liliana, Heretical Healer especially. I sold this spec with only a profit of 16%. Liliana saw its price touching the 15 tix mark during Pro Tour BFZ and I clearly should have sold my copies at that time, for 13 tix or so profit per copy. Did I mention the turnover factor before?
Selling during a spike without further expectation is not as easy as it seems. It is always tempting to wait for more. Next thing you know you are hoping for a second spike while the price is dropping, then you're hoping for a rebound to occur, then hoping for the price to peak back up a little bit so you can break even, and finally you are just hoping to sell above bulk price.
Remember that turnover of 79 days for +80% profit? Well then my 12 tix invested in Liliana could have been turned into 26-30 tix by October 15th, then turned into 45-48 tix by the end of December. Instead, my 12 tix worth of Liliana got turned into 16 tix mid-December, not really quite the same.
Monastery Mentor is the counterexample. I sold it mid-October for 9.5 tix. If I had waited to the last minute I might have been able to sell for 24 tix or so. 14 tix may seem like a big loss on a single position, but the 9.5 tix I collected from Mentor got reinvested and turned into 17 tix by the end of December. In light of this, the difference isn't as big as it seems at first glance.
The one big difference is that when I sold my copies of Monastery Mentor my profits were locked in, and I also knew I'd make a profit reinvesting those tix. On the other hand, back in October I had a hypothetical situation where, maybe, Monastery Mentor could have risen in price. But it could have lost value as well in the following weeks or months---I'm not a fortune teller after all.
As with Liliana and Rhino, selling the Mentor was the right decision (which I fortunately made in this case) and the decision that ended up making me more "sure" tix.
The same can be said of Eye of Ugin. This land could have made me 200 tix for an initial investment of 1.56 tix. Despite any regrets one could have, I was extremely happy with this spec. When I sold my copies of Eye of Ugin it was a good decision according to what I knew at that time. Modern Eldrazi decks were not on my radar and there was no reason to wait with a spec that had just yielded over 1,000% profit!
Coming back to Magic Origins, I think a lot of these specs will pan out later this year. The five painlands may see more demand after the release of Oath of the Gatewatch with the potential increased need for colorless mana. They should also have an even better spot once Khans of Tarkir and its fetchlands rotate out of Standard later in April.
As we've come to expect each year, the upcoming sets, Oath and Shadows over Innistrad, and the Standard rotation are likely to make other ORI cards (besides Jace, Vryn's Prodigy) playable and valuable. I’m holding all of my ORI targets on my main account at this point.
A few words on Pauper. While volatile, Pauper specs did great in this project. This volatility can actually be great for growing your bankroll if you can pay enough attention to price variations and buy/sell accordingly. With the success of Pauper leagues, prices are up all over the place and appear to be well supported. We might begin to see price cycles such as those observed for Modern.
What's Next?
The "100 Tix, 1 Year" project was really great. Thank you for all the comments and I hope you enjoyed the project and the reports as much as I did. Many asked if there will be a sequel to the "100 Tix, 1 Year" project or if I would keep going with the account in 2016. Unfortunately there won't be a second edition of the "100 Tix, 1 Year" project. But we are working on something similar!
The new project may involve a much bigger bankroll, still with the possibility of following real-time speculations. I intend to launch the new series by the end of January. Stay tuned for more details.
Thank you for following and reading!
Sylvain Lehoux





absolutely loved this project. it is one of the main reasons I joined QS and gave a real life speculation project for the smaller bankroll investors like myself. thanks for all the work you put in it definitely paid off!
Thanks for the comment Jonathan! and thank you for following.
Great analysis from beginning to end. The most interesting statistic from this report, is average % return based on format. It really shows that investment focus should be on modern/pauper and not standard (I do think the fact you had to prematurely close positions at the end definitely skews the standard numbers some).
Your work on this project has helped me tremendously with my own mtgo speculation. Thank you for all the work you’ve done.
Thanks for the comment. Clearly yes the Standard results got skewed because of the premature end of this project. However, at the same time of the year with M14 and M15 specs for instance (rares and mythics)I was much more positive, probably around 50% with M15 positions. I think that Jace might also be partly responsible for sucking up a lot of value of ORI cards, which is about to change…
Would love to see the same general idea but with a 1K or so bankroll
The project in preparation will involved a much larger bankroll, much larger than 1K.
I also also looking forwards to a 1k roll. Guess we will be seing the entire roll now instead of limiting himself to a smaller than max. Will still be interesting but will not be the same since probably cannot be done by most followers at the same time. Also the bankroll having a very big importance on what is to be invested in/or how will give a different outlook. Eager to watch it unfold regardless.
Well done. I wish I had followed more closely now! I don’t even follow you on Twitter, I have a year and 500 tix worth of regret!!!
A few questions though.
Your two dot graphs only have one axis. So the first, with % gains, is vertical, with Eye of Uginnat the top, but they are spread out horizontally as well. What’s the horizontal axis signify? And the next graph is horizontal, with no vertical.
Also, in the last paragraph, you mention “We are working on something similar.” Is “we” equal to you and Matt? His article today says you two aren’t writing together any more, but yours makes me think you are.
I hope you don’t mind so many questions, I’m obviously very interested in MTGO speculating, and data visualisation too.
In these two graphs the “other” axis do not represent anything. Dots are spreadout only for a better visualization. If dots were not in a “cloud” shape you would only see a straight line without the possibility to really distinguish dots from one another. It gives should a better idea of the density and as to where are the bulk of the points.
By “We” I mean myself and the QS editorial staff, to make sure “we” deliver the best format. So it will be something in addition to what Matt is doing with the MTGO market report.
Off course I don’t mind any questions, no problem at all.
Still looking through older articles but something I have the least used (if ever, intentionally anyways) are quick flips as I am interested in diversifying. Any quick tips on tips, how you choose the targets which tools if any are being used etc?
On first glance the price history seems to play a very bog role on this and trying to find the cards that bottomed for some reason seems to be the first thing to look into. Anywho cheers!
Mtggoldfish is probably the most important tool. For cyclical positions, such as Modern mostly, having a visual on price history is the determinant factor on when to buy and sell.
For Standard positions, or full sets for instance, on the other hand it’s more a matter of knowing the “seasons” of when it’s best to buy and sell. Here as well Mtggoldfish charts help but only as a comparison tool. For instance, I’ll compare mythics from different sets to guide me in the determination of the best selling price. Or to compare with other sets as to when such cards or full set price started declining or rising.
Another helpful “tool” is trying to get as much info from anywhere else: forums, tweeter, tournament result, announcement, etc… Getting more info help you make faster and better decision, or reinforcing a thought you may have.
I often look at daily gainers/losers on mtggoldfish. This is great to know what’s happening and to be very familiar with a lot of prices. When something looks odd I try to get more info on why it happens. But I also always keep in mind the main trend I was following for each spec. Sometime prices jump or fall only to go back on track within a week, so price trends don’t always dictate everything.
I was amazed at how well you did last year. It was fascinating!
Thanks for showing us what’s possible, I followed it every week.
I too made profit, but not even close to the percentage you made! Well done.