Are you a Quiet Speculation member?
If not, now is a perfect time to join up! Our powerful tools, breaking-news analysis, and exclusive Discord channel will make sure you stay up to date and ahead of the curve.
I'm interrupting this spoiler season with an important bulletin: it's time for the metagame update! And this will be a strange one. Although... I'm not entirely clear on what a normal metagame update might look like. I mention that there's something unexpected happening every month. It's never the same weird thing, but it's always something diferent. So, maybe I should be saying "Guess this month's oddity!" Or maybe just shut up and get to the data. Let's go with the latter.

Something to note, even though it doesn't affect anything, is that paper events have started to return. I went to my first in-person FNM in 14 months last week, and it felt amazing. However, it was slightly tempered by the knowledge that eventually, I'll have to include paper events in this data. I'm not sure exactly how I want to deal with paper. The old system wouldn't work quite as well anymore due to overweighting the online results. I'll have to figure out how properly integrate the paper results before actual large events start up again. Probably not for several months if not until 2022. But better to get ahead of the problem.
The Problem With Prowess
Speaking of problems, Izzet Prowess was a huge problem in May. It vastly over-performed relative to the rest of the field and was skewing the data. This probably sounds familiar, and that's because it should: I said almost the same thing about Heliod Company last month. However, I decided to include Heliod Company in the data because I could not conclusively determine if it was an outlier. This time, it wasn't a problem. Izzet Prowess was clearly an outlier and multiple tests confirmed this as the case. Here's the Izzet Prowess data from May compared to Heliod Company's from April.
| Izzet's Total # | Heliod's Total # | Izzet's Total % | Heliod's Total % | |
|---|---|---|---|---|
| Population | 75 | 59 | 15.36 | 11.46 |
| Points | 116 | 107 | 14.68 | 11.53 |
| Average Points | 1.55 | 1.81 |
Izzet earned significantly more places and points than Heliod did. That alone might qualify Izzet as an outlier, but the clearer visualization (which I couldn't get onto the table in a way I found ascetically pleasing) is the degree to which they respectively outstripped the competition. Heliod's population was 1.59x's above its next competitor (Izzet Prowess, go figure) and earned 1.53x's the points in April. Izzet Prowess beat Eldrazi Tron's population by 2.5x's and its points by 2.37. That's an absurd gap and would have led me to declare an outlier even if the actual statistical tests had disagreed. Which they decidedly did not.
As a result, I am reporting Prowess's data, but I did not include it in the analysis. Had I included it, Izzet Prowess would have been the only Tier 1 deck. And the number of decks making the list would have plummeted, another clear indication of an outlier. By removing Izzet Prowess, the resultant analysis looks more normally distributed and I believe gives a more accurate picture of what the metagame looks like.
It's NOT Tier 0!
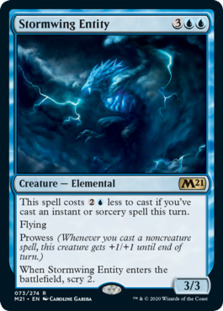 After all I've said, there is a temptation to declare Izzet Prowess Tier 0, something I've never done before. I will resist this temptation and everyone reading should do so too. Izzet Prowess is nothing like Hogaak, Arisen Necropolis or Eye of Ugin-powered Eldrazi. The deck is slightly different from the previous few months when it was Tier 1, but not outstandingly so. Plus, it's taking over the top slot from another deck that just spiked out of nowhere. There's no reason to think that this spike won't also go away.
More importantly, I can explain away Izzet's numbers as nothing more than absurd, unexpected, and arguably unjustified popularity. Check the table again: Izzet averaged only 1.55 points per placement. Which is considerably lower than Heliod's from April, but doesn't really mean much, because the average is a moving peg to be compared 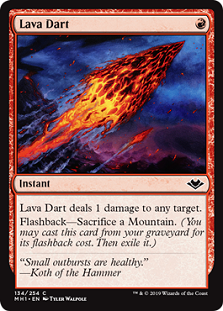 to the baseline. And May's baseline average points is 1.58, meaning that Izzet's performance was slightly below average given its population. To be Tier 0, I'd expect any deck to take down sufficient Top 16 or higher slots to stay above the base. Not necessarily sky-high, but well above the baseline.
I can say with certainty from going through all the results: Izzet did not do that. Its position in the tier list is thanks to putting up lots of Preliminary 3-1 and Challenge Top 32 results. It had some good Challenges, but mostly was an average performer. If a deck is adopted in large numbers, it should get lots of results, and the data reflects an expected results from mass adoption.
A Plausible Explanation
I have no idea why Izzet Prowess was so popular. I have no way of finding out besides surveying hundreds if not thousands of MTGO players about their deck choices. I'm too lazy to try to track down individual players and no better than to trust online survey data. I can, however, at least make a grounded and educated guess.
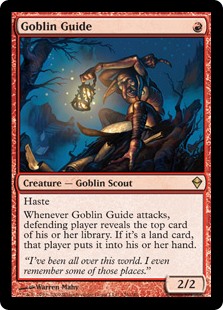 Observation #1: Red decks are popular online
For as long as Modern Nexus has been doing metagame data, we've observed that red decks tend to be more popular online than in paper. There's never been a good explanation for this deviation other than red decks tend to be cheaper than the alternatives. It's never been universally true, but it tends to be accurate. Assuming that players don't like spending money on digital cards, which is plausible, this would lead them to favor red decks over alternatives.
Observation #2: The online metagame is very volatile
Just look back at all the metagame articles I've written. The composition of each tier and which deck belongs where changes wildly month to month, far more than when there were paper results to consider. This is likely caused by the next observation...
Observation #3: Rental services reduce the opportunity cost of deck switching
Straightforward enough—if you don't have to constantly buy and sell cards to make new decks, you can experiment and change decks easily. There's a reason players will buy one deck in paper and play it for years, regardless of metagame positioning (*cough* Jund).
 Observation #4: There is a correlation between price spikes and decks falling off
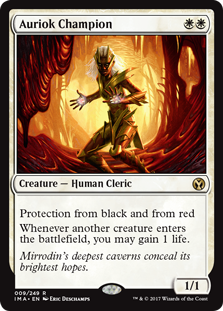
Looking at the price history of key cards and the metagame data suggests that price is a significant factor in deck popularity. For example, Auriok Champion is a key card in Heliod Company. It saw a huge price increase in March with multiple additional spikes in April before falling off in May. At the same time, Heliod exploded in popularity in March, peaked in April, and is no longer anything special. There is a similar pattern for other key cards like Heliod, Sun Crowned. Stormwing Entity is repeating this pattern. Correlation isn't causation, but it is suggestive.
Conclusion: Izzet Prowess's popularity was due to it being cheap to rent. Once the rental time is up, the ongoing card price spike will drive players away, and Izzet will fall off.
We'll see in July whether I was right. But with that out of the way, let's shift gears away from Izzet Prowess to look at the rest of the metagame data.
April Metagame
To make the tier list, a given deck has to beat the overall average population for the month. The average is my estimate for how many results a given deck “should” produce on MTGO. Being a tiered deck requires being better than “good enough;” in May the average population was 6.88, meaning a deck needed 7 results to beat the average and make Tier 3. This is a pretty standard average as these go. Then we go one standard deviation above average to set the limit of Tier 3 and cutoff for Tier 2. The STdev was 7.81, so that means Tier 3 runs to 15, and Tier 2 starts with 16 results and runs to 24. Subsequently, to make Tier 1, 25 decks are required. Amazing how all those numbers are the lowest ever after I cut out the top performer. Almost like that's how math works.
The Tier Data
May’s data was incomplete relative to April, though not as bad as March's. A PTQ and at least two Challenges did not get reported for reasons unknown. I've been reliably informed that these events were scheduled and fired, so I'm guessing Wizards just messed up. The loss is not severe, but it does mean the individual decks fell slightly from 65 to 61. Had I included Izzet Prowess in the analysis, total decks would have fallen from 20 to 16. Because Izzet was excluded, instead the total decks rose to 23. Which is impressive considering how many slots Izzet gobbled up.
Eldrazi Tron was the best non-Prowess deck. This is not surprising, as mainboard Chalice of the Void grants it an above-average matchup against the most popular deck. I expect E-Tron to maintain a high position so long as prowess variants are popular and disappear again once prowess isn't everywhere. Regular Burn just missed Tier 1 status. Eidolon of the Great Revel is of course very good against Prowess, but Burn is also a red deck that dodges a lot of Prowess specific hate.
Power Rankings
Tracking the metagame in terms of population is standard practice. However, how do results actually factor in? Better decks should also have better results. In an effort to measure this, I use a power ranking system in addition to the prevalence list. By doing so I measure the relative strengths of each deck within the metagame. The population method gives a decks  that consistently just squeaks into Top 32 the same weight as one that Top 8’s. Using a power ranking rewards good results and moves the winningest decks to the top of the pile and better reflects its metagame potential.
Points are awarded based on the population of the event. Preliminaries award points for record (1 for 3 wins, 2 for 4 wins) and Challenges are scored 3 points for Top 8, 2 for Top 16, 1 for Top 32. If I can find them, non-Wizards events will be awarded points according to how similar they are to Challenges or Preliminaries. Super Qualifiers and similar level events get an extra point if they’re over 200 players, and a fifth for over 400 players. There were 2 events that awarded 4 points in May but no 5 pointers. The missing PTQ may have been worth 4 or 5 points for all I know.
The Power Tiers
The total points in May were down from April, from 928 to 790. It would have been higher if all the events had been reported, but still wouldn't make April's numbers because there were fewer events. The average points were 11.23, so 12 points makes Tier 3. The STDev was 12.92, which is relatively small just like with population, so Tier 3 runs to 25 points. Tier 2 starts with 26 points and runs to 39. Tier 1 requires at least 40 points. Both Inverter and Grixis Death's Shadow failed to make the power list and no other decks replaced them. Inverter just missed with 11 points, but GDS had as many points as it had entries. It epitomizes the deck that made the tiers thanks entirely to population, not being good.
Heliod just misses Tier 1. Oh, how the ostensibly broken have fallen. Also worth noting that the top of Tier 2 is mostly red decks. Players should really be metagaming against that color more than they are.
Average Power Rankings
 Finally, we come to the average power rankings. These are found by taking total points earned and dividing it by total decks, which measures points per deck. I use this to measure strength vs. popularity. Measuring deck strength is hard. Using the power rankings certainly helps, and serves to show how justified a deck’s popularity is.
However, more popular decks will still necessarily earn a lot of points. This is where the averaging comes in. Decks that earn a lot of points because they get a lot of results will do worse than decks that win more events, indicating which deck actually performs better. A higher average indicates lots of high finishes, where low averages result from mediocre performances and high population. Lower-tier decks typically do very well here, likely due to their pilots being enthusiasts. So be careful about reading too much into the results.
The Real Story
When considering the average points, the key is to look at how far-off a deck is from the baseline stat (the overall average of points/population). The closer a deck’s performance to the baseline, the more likely it is to be performing close to its “true” potential. A deck's average points equaling the baseline means that it performed exactly in line with its representation. The further away from the baseline a deck's average is, the more that deck under- or over-performs. On the low end, the deck’s placing was mainly due to population rather than power, which suggests it’s overrated. A high-scoring deck is the opposite.
 Sultai Control was the best-performing deck relative to its popularity in May. What is Sultai Control? I'm using the descriptor as a catchall term for slow, answer-heavy BUG decks. Each deck was pretty different from the others, united only in speed and strategy. Which may have contributed to its good performance. It didn't actually make the power tier, and so isn't included, but Grixis Death's Shadow did the worst of any deck I've ever had in these articles. Its average power is 1; its presence in the population tier can therefore be attributed to its pilots stubborn dedication to their deck and not to any real success. Which is a paper-player attitude, and not something I'd count on from MTGO players.
Prepare for the Unexpected
In addition to the expected Izzet dropoff, June's update will be wildly different thanks to Modern Horizons 2's arrival. I predict a big surge in Merfolk's popularity. Now I wait to see how prescient I really am.


