Are you a Quiet Speculation member?
If not, now is a perfect time to join up! Our powerful tools, breaking-news analysis, and exclusive Discord channel will make sure you stay up to date and ahead of the curve.
The calendar may have rolled over to 2022, but 2021 isn't truly over yet. Sorry to crush everyone's souls, but there's business still unfinished from the previous year. And we'll need to move quickly to get it all taken care of before the next set releases. It's not like we can just put off spoiler season. Therefore, let's refocus on the end of last year with the December 2021 metagame update.
December’s metagame is an unfortunate continuation of trends observed back in November. Which is surprising under the circumstances The number of events was slightly lower thanks to reported non-Wizards events on MTGMelee and fewer Wizards Premier events, as usually happens in December; it's the end of the year and the holidays, who wants to run extra events? In the past that reality led to a decline in population for December's metagame. However, 2021 is an exception. The overall population is slightly above November's at 514, with 528. This in spite of the lack of events seems incongruous, but it makes sense on my end. December had a number of very large Preliminaries. School's out so more players were playing more events is my take on why.
An Announcement
With the new year, I'm planning on changing how these updates work. Specifically, I am  hoping that this is the last metagame update whose data comes entirely from MTGO. I wanted to keep my data consistent during 2021 and stuck to just MTGO data despite paper kinda coming back in March. In truth, even if I had included the paper results, it wouldn't have changed anything until recently. There haven't been many paper events over the past year, but the number has been increasing, so I'm going to start tracking those too. And hoping that there are enough to balance the MTGO data.
What this actually means for how the updates and analysis work I don't yet know. I haven't been scrutinizing paper results too closely, so I'm not sure what has been there nor what will be there. I'll figure it out as I see what I have to work with. I may have to go back to the old system, I may be able to make the current one work; I don't know. Right now, the only source I have for said paper events is MTGTop8, but I'm looking for more sources... and am open to suggestions!
December Metagame
To make the tier list, a given deck has to beat the overall average population for the month. 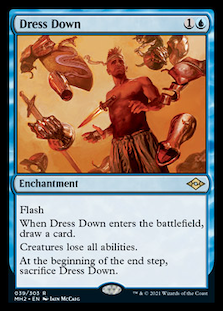 The average is my estimate for how many results a given deck “should” produce on MTGO. Being a tiered deck requires being better than “good enough;” in December the average population was 8.95 setting the Tier 3 cutoff at 9 decks. This is the highest the cutoff has been in months and is a mark we haven't hit since September 2020. The reason this happened will be clear once you're looking at the data.
Tier 3 begins with decks posting 9 results. Then we go one standard deviation above average to set the limit of Tier 3 and cutoff for Tier 2. The STdev was 15.70, which means that means Tier 3 runs to 25 results. Again, it's the starting point to the cutoff, then one above for the next Tier. The STdev was really high this month and so the tier ranges are enormous. Again, it makes sense given the data. Therefore Tier 2 starts with 26 results and runs to 42. Subsequently, to make Tier 1, 43 decks are required. Which is a very high cutoff point, especially in context for this year.
The Tier Data
While the total population is slightly up from November, the number of unique decks fell significantly. Where 67 unique decks were recorded in November, I only have 59 for October. The number of decks actually making the tier list also fell significantly, from 19 in November to 13 for December.
Now, some of that is thanks to me accounting for outliers in November, which lowered the threshold. I didn't remove Hammer Time as an outlier from the data in December, though it's really borderline. Several tests showed it clearly being an outlier, while several said it was right on the line. The decision came down to whether removing Hammer Time from the data changed anything, and the answer was no. Accounting for outliers would have added one deck to the population tier and slightly altered placement, which tells me that the data is fundamentally skewed and therefore the outlier isn't really meaningful.
And that's because of how incredibly top-heavy the data is. There have been big gaps in the data before, but they've never been as big as this. 20 results separate the bottom of Tier 1 and all of Tier 2, a tier that just barely has any decks at all, since UW Control and Cascade Crashers are right on the cutoff. That's absurd and unprecedented. And again, accounting for outliers wouldn't have helped. since the Tier 2 cutoff without Hammer Time in the analysis was 20, meaning the tier composition wouldn't change. Another reason not to bother removing Hammer Time from the data analysis.
The Trend Continues
Back in November, I expressed concern over Hammer Time's continued dominance of the tier list and the rise of 4-Color Blink piles. The former is bad since one deck sitting atop the metagame has a chilling effect, especially when it happens by such a wide margin. The latter is bad because if forces out alternatives. A pile of the best cards just overpowers more 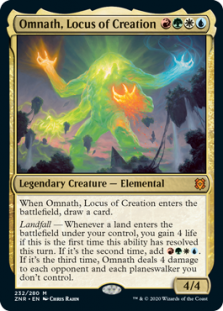 distinct decks and homogonizes the format. I hoped that something would happen in December to stall or reverse this trend, but as the data shows, it didn't happen. Which was the concern hanging over my mind when I was making the Banning Watchlist.
It's always tempting throw everything back to the situation with Uro, Titan of Nature's Wrath. Certainly, the data from December 2020 and January 2021showed a similar trend toward 4-Color decks pushing out other midrange decks. However, there was more internal homogenization with Uro: the decks started looking the same. Right now, there is considerable diversity within the Omnath blink decks, which possibly means that there is no single build that is best (an oppressive situation) but rather the deck can be built to win in any metagame. That's still not great because there'd be no way to beat Omnath consistently, but it does mean that deckbuilding and player agency matter, and might delay any bannings for a while. Still, I'm quite worried.
Power Rankings
Tracking the metagame in terms of population is standard practice. But how do results actually factor in? Better decks should also have better results. In an effort to measure this, I use a power ranking system in addition to the prevalence list. By doing so, I measure the relative strengths of each deck within the metagame. The population method gives a deck  that consistently just squeaks into Top 32 the same weight as one that Top 8’s. Using a power ranking rewards good results and moves the winningest decks to the top of the pile and better reflects its metagame potential.
Points are awarded based on the population of the event. Preliminaries award points for record (1 for 3 wins, 2 for 4 wins, 3 for 5) and Challenges are scored 3 points for Top 8, 2 for Top 16, 1 for Top 32. If I can find them, non-Wizards events will be awarded points the same as Challenges or Preliminaries are depending on what the event in question reports/behaves like. Super Qualifiers and similar higher-level events get an extra point and so do other events if they’re over 200 players, with a fifth point for going over 400 players. There were two 4 points events in October and no 5 pointers.
The Power Tiers
Unlike with population, the total points were down slightly in November. There are 889 total points in November compared to October's 927. There being fewer events overall and fewer premier events specifically, the lower total makes sense. It also means that the data is even more skewed towards Tier 1 than it was for population.
The average points were 15.07. Since that's so close to 15 rather than 16, I'm rounding down to have 15 points be the starting point. Therefore 15 points makes Tier 3. The STDev was 28.21, which is enormous just like with population. And again, given the skew it makes statistical sense. Thus add 29 to the starting point and Tier 3 runs to 44 points. Tier 2 starts with 45 points and runs to 74. Tier 1 requires at least 75 points. Had I removed Hammer Time as an outlier, there would have been more five more decks on the power tier. As is, the number fell from 13 to 11.
I've never had a power update featuring three decks over 100 points. Again, it reinforces what I said earlier that this metagame is significantly top-heavy. Hammer Time, 4-Color Omnath, and Grixis Death's Shadow account for a staggering 40% of the total points earned in December. And there's a 32-point gap from GDS to UR Murktide. No wonder the number of decks were down, the month appears to be a three-horse race! How is anything else going to compete?
Removing Hammer Time as an outlier would have improved the data's look as mentioned. However, I don't think that it changes the feel. UW Control would have been joined by Cascade Crashers and Yawgmoth in Tier 2 and a few more decks would have snuck onto the bottom of Tier 3. But it doesn't change the fact that the data was heavily skewed. And that's the real story of December.
What Happened?
Obviously, I can't say with certainty "This is what happened" to cause this warp. It is a continuation of trends from December, but it's also very extreme. And would seem to fly in the face of expectation given the higher population. What I can do is propose plausible scenarios and discuss what they suggest about the metagame:
- It's happening: No mistakes, no warps: the metagame is naturally pushing in this direction and players are picking up on it. I'd consider this a worst-case scenario, as it implies that Modern is solved.
- Sampling bias: This is just one data point. That data point came from a month where outside pressures created odd wrinkles in player behavior. It was the holidays, so presumably, players had more time to play and just chose what they thought were the best decks. If this is the case, the warp should disappear in January.
- Player Bias: The warp isn't a fluke, but it doesn't mean anything. Grixis Death's Shadow is a deck lots of players bought into in 2017. Now that it appears to be viable again, those players are flocking back. The pressure from that deck is pushing out alternatives. Once the shine wears off, there will be an exodus from GDS and the format will open up more.
Average Power Rankings
Finally, we come to the average power rankings. These are found by taking total points earned and dividing it by total decks, which measures points per deck. I use this to measure 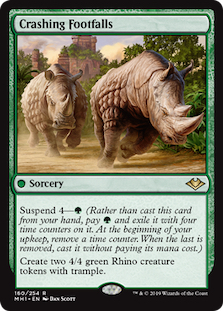 strength vs. popularity. Measuring deck strength is hard. There is no Wins-Above-Replacement metric for Magic, and I'm not certain that one could be credibly devised. The game is too complex, and even then, power is very contextual. Using the power rankings certainly helps and serves to show how justified a deck’s popularity is. However, more popular decks will still necessarily earn a lot of points. Which tracks, but also means that the top tier doesn't move much between population and power, and obscures whether they really earned their position.
This is where the averaging comes in. Decks that earn a lot of points because they get a lot of results will do worse than decks that win more events, indicating which deck actually performs better. A higher average indicates lots of high finishes, where low averages result from mediocre performances and high population. Lower-tier decks typically do very well here, likely due to their pilots being enthusiasts. So be careful about reading too much into the results. However, as a general rule decks which place above the baseline average are overperforming and vice versa. How far above or below that average determines how "justified" a decks position on the power tiers are. Decks well above baseline are therefore undervalued while decks well below baseline are very popular but necessarily especially good.
The Real Story
When considering the average points, the key is looking at how far-off a deck is from the Baseline stat (the overall average of points/population). The closer a deck’s performance to the Baseline, the more likely it is to be performing close to its “true” potential. A deck that is exactly average would therefore perform exactly as well as expected. The further away the greater the deviation from average, the more a deck under- or over-performs. On the low end, the deck’s placing was mainly due to population rather than power, which suggests it’s overrated. A high-scoring deck is the opposite.
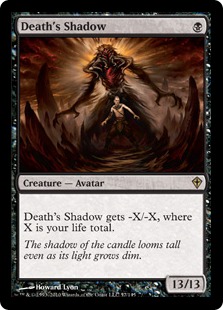 I've never had the baseline be this low before. 1.50 is extremely low and really highlights just how poorly positioned Amulet Titan was to be the only deck below the baseline. However, given again how high the STdev's were thanks to the huge number of singletons versus the Big Three, it does make sense. It's just unfortunate. In any case, here's your headline: as the Tier 1 deck with the highest average points, Grixis Death's Shadow was the top deck of December 2021!
The End Is... Not Yet
And that's the metagame update for December 2021. But don't rejoice yet! Next week I will actually conclude 2021 with the overall data for the entire year. And it wasn't quite what I expected, so perhaps you'll share my surprise.


