Are you a Quiet Speculation member?
If not, now is a perfect time to join up! Our powerful tools, breaking-news analysis, and exclusive Discord channel will make sure you stay up to date and ahead of the curve.
Modern Horizons 3 released June 11 online and June 14 in paper and has overhauled the metagame, though perhaps not as completely as feared/hoped. I do caution that we're still in the honeymoon phase. There are a ton of new, playable cards and everyone's so excited to play with them. Obviously. As such, just because an older deck has fallen off, don't declare it dead. Give it a month, and then we'll see where things sit once the shine rubs off the new cards.
Data Problems
June's data is strange. For reasons unknown, Daybreak stopped publishing any Magic Online (MTGO) deck lists on June 20. I'd wager that Wizards wasn't happy about how open Daybreak was being with the data, given Wizards' belief that more data leads to formats being solved too easily. I'm writing this on July 5, and at this time there's been no communication about when or if decklists will be published again. This complete silence would tend to corroborate lawyers being involved. As such, the MTGO data only covers June 11-20, showing where things stood before the Pro Tour but not how the whole month went.
On the paper side, Pro Tour Modern Horizons 3 had a massive impact on the data. There are a number of outliers in paper, and they're all the decks that did well in Amsterdam. That said, this matters less than I expected. If you remove the PT data from the rest, the Tier list is shorter but not significantly changed. The top deck is still an outlier, but the others aren't and so the bottom moves up slightly. However, the list's order and tier composition are otherwise unchanged. There's a warp, but the warp barely matters.
I suspect this is down to the spread in paper's data. About 2/3 of the unique decks are singletons or duos, which created a massive skew in the data. Consequently, regardless of how the top turned out, paper's stats were always going to be quite low. Huzzah for diversity?
The Outliers
On that note, there are four outliers in the paper data this month. It's basically what you'd expect; the top four decks from the Pro Tour are statistical outliers because of the Pro Tour's effect on the data. To be clear, they'd still have been the top four decks without the PT, but not by enough to be outliers except for maybe Nadu Breakfast.
The lower than typical population for MTGO made me think that it wouldn't have any outliers, but the tests showed Ruby Storm very clearly was the only online outlier. Since the data ends the week before the PT, it makes sense. Nadu was threatening, but its earlier incarnations were fairly clunky. Meanwhile, Storm just shot out of the gates.
June Population Metagame
To make the tier list, a given deck has to beat the overall average population for the month. The average is my estimate for how many results a given deck "should" produce in a given month. To be considered a tiered deck, it must perform better than "good enough". Every deck that posts at least the average number of results is "good enough" and makes the tier list.
Then we go one standard deviation (STdev) above average to set the limit of Tier 3 and the cutoff for Tier 2. This mathematically defines Tier 3 as those decks clustered near the average. Tier 2 goes from the cutoff to the next standard deviation. These are decks that perform well above average. Tier 1 consists of those decks at least two standard deviations above the mean result, encompassing the truly exceptional performing decks.
The MTGO data nearly exclusively comes from official Preliminary and Challenge results. Leagues are excluded, as they add analytically useless bulk data to both the population and power tiers. The paper data comes from any source I can find, with all reported events being counted.
While the MTGO events report predictable numbers, paper events can report anything from only the winner to all the results. In the latter case, if match results aren't included, I'll take as much of the Top 32 as possible. If match results are reported, I'll take winning record up to Top 32, and then any additional decks tied with 32nd place, as tiebreakers are a magic most foul and black.
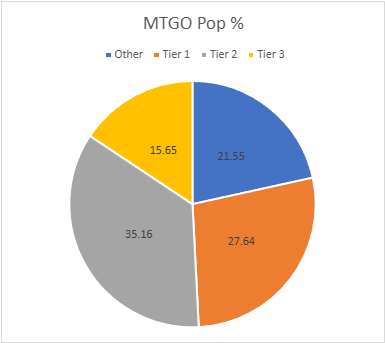
The MTGO Population Data
May's adjusted average population for MTGO was 5.70. I always round down if the decimal is less than .20. Tier 3, therefore, begins with decks posting 6 results. The adjusted STdev was 7.67, so add 8 and that means Tier 3 runs to 14 results. Again, it's the starting point to the cutoff, then the next whole number for the next Tier. Therefore Tier 2 starts with 15 results and runs to 23. Subsequently, to make Tier 1, 24 decks are required.
The aforementioned data cutoff means that June's population is down significantly. There are only 492 decks in the sample population, less than half of the next lowest population from March. That said, the fall in sample size didn't presage a fall in diversity. The total number of decks in my data set matched May's total of 79. This means that the unique deck ratio rose from .055 to .16, which is the highest I've seen since I started doing this stat. The number of tiered decks rose to 22, reflective of the exploration that was happening on MTGO when the data was taken away.
There are a wide range of new and old decks in the metagame. I'll be talking about Nadu more in the analysis section. Living End persists despite the Violent Outburst ban, which I just realized is a major flavor win. Burn surged into Tier 1 thanks to a phenomenal matchup against Ruby Storm. It's not Storm's worst matchup, but it's up there. Meanwhile, Prowess has been redesigned around Amped Raptor and Unstable Amulet.
Meanwhile, Tron's gone colorless to leverage Devourer of Destiny. I hesitate to call it Prison Tron as this is what Prison Tron looks like. That deck was a true hard lockdown prison deck. The current versions are more like the Legacy Mono-Red Stompy decks which use prison cards to disrupt the opponent before dropping large, accelerated threats. Rakdos Scam has massively fallen, but its niche has been taken by mono-black Necrodominance decks.
Tamiyo, Inquisitive Student // Tamiyo, Seasoned Scholar has driven a huge resurgence in blue control decks. Many are going the Wizards route to utilize Flame of Anor, with Izzet being the most popular configuration. However, the most successful control deck by far has been Phlage, Titan of Fire's Fury control. There are a wide range of Jeskai decks built around Phlage, though I'm grouping them all together. They're insufficiently differentiated to individually classify.
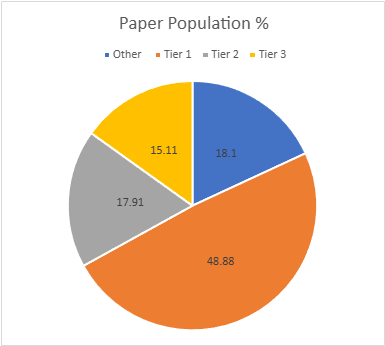
The Paper Population Data
Despite losing the first two weeks of the month, June had a solid paper population. January had 803 decks, February 890, March had 311, April hit 559, May fell to 389, and now June has 536. As with MTGO, paper's diversity is up, though it's not as dramatic. May has 66 unique decks and a ratio of .169, while June has 97 decks and a ratio of .181.
I'll note here that I didn't take the PT results from the final standings. The draft portion plays such a huge factor in the final standings that it feels wrong. Instead, I used the list of best constructed performances.
The population increase means that 29 decks made the tier list. The adjusted average population was 3.75, so 4 results make the list. The adjusted STDev was 4.64, so the increment is 5. Therefore, Tier 3 runs from 4 to 9, Tier 2 is 10 to 15, and Tier 1 is 16 and over.
The most notable difference between the paper and online results is that Domain Zoo is on the paper tier list. This is not referring to any one deck but the whole archetype. So swift, the Leyline falls. Based on what I was seeing on MTGO, I wasn't expecting any Domain decks to remain in paper, but the Ragavan Counterspell Domain...thing is still hanging around alongside Cat decks, which have turned away from counters and towards more cats to synergize with Ajani, Nacatl Pariah. There currently aren't enough of these decks to be make separating them worth my time, but we'll see how it develops.
May Power Metagame
Tracking the metagame in terms of population is standard practice. But how do results actually factor in? Better decks should also have better results. In an effort to measure this, I use a power ranking system in addition to the prevalence list. By doing so, I measure the relative strengths of each deck within the metagame so that a deck that just squeaks into Top 32 isn't valued the same as one that Top 8's. This better reflects metagame potential.
For the MTGO data, points are awarded based on the population of the event. Preliminaries award points based on record (1 for 3 wins, 2 for 4 wins, 3 for 5), and Challenges are scored 3 points for the Top 8, 2 for Top 16, and 1 for Top 32. If I can find them, non-Wizards events will be awarded points the same as Challenges or Preliminaries depending on what the event in question reports/behaves like. Super Qualifiers and similar higher-level events get an extra point and so do other events if they’re over 200 players, with a fifth point for going over 400 players.
Due to paper reporting being inconsistent and frequently full of data gaps compared to MTGO, its points work differently. I award points based on the size of the tournament rather than placement. For events with no reported starting population or up to 32 players, one point is awarded to every deck. Events with 33 players up to 128 players get two points. From 129 players up to 512 players get three. Above 512 is four points, and five points is reserved for Modern Pro Tours. When paper reports more than the Top 8, which is rare, I take all the decks with a winning record or tied for Top 32, whichever is pertinent.
The MTGO Power Tiers
As with the population numbers, total points are down, from 2499 to 820. The adjusted average points were 9.53, therefore 10 points made Tier 3. The STDev was 13.10, so add 13 to the starting point, and Tier 3 runs to 23 points. Tier 2 starts with 24 points and runs to 37. Tier 1 requires at least 38 points. Both Amulet Titan and Merfolk fell off and weren't replaced.
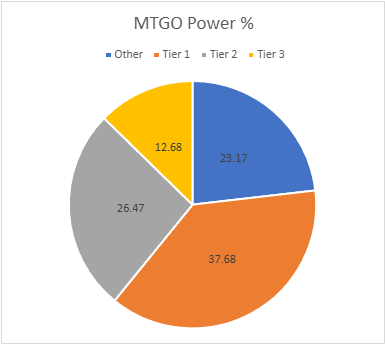
It might come as no surprise that two decks using the most played non-Nadu MH3 cards managed to move up from Tier 2 to Tier 1. If that is the case, you are very cynical.
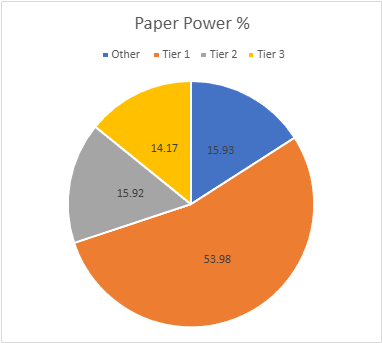
The Paper Power Tiers
As with the population, total paper points are up from 645 to 1256. The adjusted average points were 7.92, setting the cutoff at 8 points. The STDev was 11.37, thus add 12 to the starting point and Tier 3 runs to 20 points. Tier 2 starts with 21 points and runs to 33. Tier 1 requires at least 34 points. Affinity and Izzet Prowess fell off the tier list and weren't replaced.
If nothing else, MH3 has made these tier lists far more dynamic than they've been in quite a while. Decks are rising and falling between tiers more often than any other month this year.
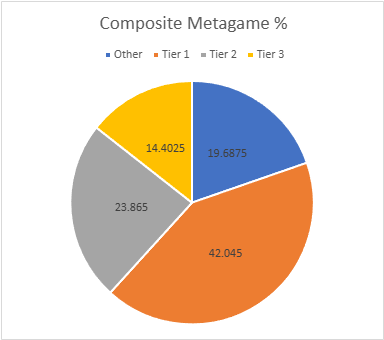
Composite Metagame
That's a lot of data, but what does it all mean? When Modern Nexus was first started, we had a statistical method to combine the MTGO and paper data, but the math of that system doesn't work without big paper events. I tried. Instead, I'm using an averaging system to combine the data. I take the MTGO results and average the tier, then separately average the paper results, then average the paper and MTGO results together for final tier placement.
This generates a lot of partial Tiers. That's not a bug, but a feature. The nuance separates the solidly Tiered decks from the more flexible ones and shows the true relative power differences between the decks. Every deck in the paper and MTGO results is on the table, and when they don't appear in a given category, they're marked N/A. This is treated as a 4 for averaging purposes.
Average Power Rankings
Finally, we come to the average power rankings. These are found by taking the total points earned and dividing them by total decks, to measure points per deck. I use this to measure strength vs. popularity. Measuring deck strength is hard. There is no Wins-Above-Replacement metric for Magic, and I'm not certain that one could be credibly devised. The game is too complex, and even then, power is very contextual.
Using the power rankings helps to show how justified a deck’s popularity is. However, more popular decks will still necessarily earn a lot of points. Therefore, the top tier doesn't move much between population and power and obscures whether its decks really earned their position.
This is where the averaging comes in. Decks that earn a lot of points because they get a lot of results will do worse than decks that win more events, indicating which deck actually performs better.
A higher average indicates lots of high finishes, whereas low averages result from mediocre performances and a high population. Lower-tier decks typically do very well here, likely due to their pilots being enthusiasts. Bear this in mind and be careful about reading too much into these results. However, as a general rule, decks that place above the baseline average are over-performing, and vice versa.
How far above or below that average a deck sits justifies its position on the power tiers. Decks well above baseline are undervalued, while decks well below baseline are very popular, but aren't necessarily good.
The Real Story
When considering the average points, the key is looking at how far off a deck is from the Baseline stat (the overall average of points/population). The closer a deck’s performance to the Baseline, the more likely it is to be performing close to its "true" potential.
A deck that is exactly average would therefore perform exactly as well as expected. The greater the deviation from the average, the more a deck under or over-performs. On the low end, a deck’s placing was mainly due to population rather than power, which suggests it’s overrated. A high-scoring deck is the opposite of this.
I'll begin with the averages for MTGO:
The amalgamated Jeskai Control deck wins June's MTGO Deck of the Month. Nadu and Storm performed fairly badly all things considered.
Now the paper averages:
While Nadu runs away with the average in paper, I don't think it actually deserves to win Deck of the Month. Both it and Necro owe their positions to being way overrepresented in Amsterdam. If not for those points, they'd be in the middle of the pack. Merfolk didn't show up there, but still put up an impressive average. Therefore, Merfolk wins June's Paper Deck of the Month.
Analysis
So, we need to talk about Nadu, Winged Wisdom. It did ridiculously well in Amsterdam. The stats make it look like it's better than Hogaak, Arisen Necropolis. Everyone expects it to be banned at the next opportunity in August. I'm not going to dispute those stats or the expectation.
However, I will dispute the feeling that Nadu is invincible. I don't know how widespread this sentiment actually is, but I heard it after the Pro Tour a lot and I'm going to vent. Looking at the event's sideboards, players were well prepared for Storm, but didn't seem to be playing hate against Nadu specifically. This meant that it didn't face as stiff of resistance as it should have, and consequently its win rate was boosted.
Nadu's winrate shouldn't be surprising then. Hogaak was affected by commonly played graveyard hate but Nadu needs more specialized answers. Just playing creature removal was provably insufficient. My observation is that succeeding against Nadu requires a different approach. The best way is to keep Nadu from hitting the board. The deck doesn't work and becomes aggressively mediocre without the namesake bird.
Thus, targeting the manabase is the best option. Bolting Delighted Halfling is good, but Blook Moon is better. After Nadu the best win condition in the deck is Urza's Saga, which also finds Shuko. Moon effects and killing mana dorks shuts Nadu down. There also the fact that the deck can be incredibly clunky and plays negligible (at best) amounts of interaction. Just winning first is always an option.
Banning Chance
Despite my belief that Nadu is perfectly beatable once taken seriously and understood, I do believe that something will be banned in August. Even if the power is overblown, Nadu's Breakfast combo is problematic for tournament logistics. It's a non-deterministic, non-shortcutable combo. There were a lot of Nadu games going to time then taking forever to win during extra turns in Amsterdam. Eggs and Miracles were banned for that, I can't fathom Wizards will let Nadu slide.
I hope Wizards just takes the hit and bans Nadu himself. We don't want to redo Bridge from Below, but more importantly, I think Nadu is a straight up mistake for Modern. To me the card reads like something intended to be in the Commander set which go emergency moved to Modern. Correcting the mistake is the optimal response.
The Rest of the Metagame
It is clear that MH3's additions put a premium on threats. MH2 slowed Modern down, but MH3 sped it back up. Amped Raptor is emblematic of this change, but the most important card in this is Guide of Souls. Guide is shockingly powerful and is the actual keystone of the new, more aggressive Modern. Unlike most energy cards, it even works well in decks that don't play any other energy cards.
It can even be seen in the control decks. Phlage ends games very quickly, and the best control decks are built to knock down whatever the opponent is doing before escaping Phlage to win. Which is quite welcome. This is a card to watch as it isn't as overwhelming as Uro, Titan of Nature's Wrath was, but it's far more powerful than Kroxa, Titan of Death's Hunger.
What surprised me is that there aren't more Eldrazi decks. I always assumed that fear of Meltdown and Wrath of the Skies would keep out artifact decks, but the only Eldrazi doing well is Colorless Tron. Eldrazi Tron and other smaller Eldrazi decks aren't doing much. I don't know why.
Finance Corner
Since everyone expects Nadu to be banned, its price and the price of the associated combo pieces are gently declining. I don't foresee this trend to reverse, so move any undesired pieces sooner rather than later. In fact, most MH3 prices outside of Phlage have been on a downward trend since the PT. Supply is increasing quickly as drafted cards move onto the market. This should stabilize in the next few weeks.
On that note, the Assassin's Creed set is out this week to the indifference of Modern players. The only card that might be Modern worthy is Senu, Keen-Eyed Protector, and it's a pretty longshot. Thus, I wouldn't buy it for Modern cards. There may be something valuable for Commander or Legacy in there, but that's not my area of expertise. Stay away from the set except to sell to rabid Creed fans.

