Are you a Quiet Speculation member?
If not, now is a perfect time to join up! Our powerful tools, breaking-news analysis, and exclusive Discord channel will make sure you stay up to date and ahead of the curve.
The long-expected ban has finally happened. And another, unexpected one. Therefore, there's no reason to hold the August Metagame Update any longer. Let it stand as a memorial to the first Tier 0 metagame I've evaluated. Also, I'll go ahead and admit that I didn't include all the results from before the ban. Anything posted after Saturday evening isn't in this data set. It was unlikely to change the conclusions, and there's no real value waiting for all the paper results to trickle in.
The End of Tier 0
As with July, Nadu Breakfast was a Tier 0 deck in paper. As a (hopefully) final reminder, a deck is Tier 0 if it is a statistical outlier above other Tier 1 decks (including other outliers) and has average points far in excess of the rest of Tier 1. It's okay to be lower than Tier 2-3 decks. Nadu is the only outlier in either play medium in August, but didn't have the best average points on Magic Online (MTGO) so it remains just Tier 1 there.
As an outlier, Nadu was removed from the statistical analysis for both paper and MTGO. It's reported in its correct position on the Tier List for the final time.
August Population Metagame
To make the tier list, a given deck has to beat the overall average population for the month. The average is my estimate for how many results a given deck "should" produce in a given month. To be considered a tiered deck, it must perform better than "good enough". Every deck that posts at least the average number of results is "good enough" and makes the tier list.
Then we go one standard deviation (STdev) above average to set the limit of Tier 3 and the cutoff for Tier 2. This mathematically defines Tier 3 as those decks clustered near the average. Tier 2 goes from the cutoff to the next standard deviation. These are decks that perform well above average. Tier 1 consists of those decks at least two standard deviations above the mean result, encompassing the truly exceptional performing decks.
The MTGO data nearly exclusively comes from official Preliminary and Challenge results. Leagues are excluded, as they add analytically useless bulk data to both the population and power tiers. The paper data comes from any source I can find, with all reported events being counted.
While the MTGO events report predictable numbers, paper events can report anything from only the winner to all the results. In the latter case, if match results aren't included, I'll take as much of the Top 32 as possible. If match results are reported, I'll take winning record up to Top 32, and then any additional decks tied with 32nd place, as tiebreakers are a magic most foul and black.
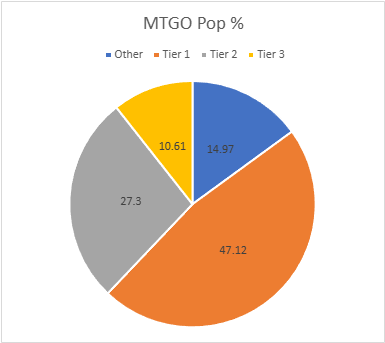
The MTGO Population Data
August's adjusted average population for MTGO was 11.6. I always round down if the decimal is less than .20. Tier 3, therefore, begins with decks posting 12 results. The adjusted STdev was 21.02, so add 21 and that means Tier 3 runs to 33 results. Again, it's the starting point to the cutoff, then the next whole number for the next Tier. Therefore Tier 2 starts with 34 results and runs to 55. Subsequently, to make Tier 1, 56 decks are required.
The population stats are down, as I'm not taking the data for the full month. MTGO therefore has an August population of 1216, down from July's 1600. The number of unique decks fell to 90 but the unique deck ratio stayed the same at 0.07, which is still really bad. The number of tiered decks is down to 19 from 22. There wasn't much reason to experiment in July and even less than August with the expected Nadu ban.
It's worth noting that if I wasn't separating the energy decks based on if they're playing Goblin Bombardment or not, they'd be up there with Nadu. They'd still not eclipse it, but it'd be much closer. I'd advise against reading into that too much, as this was not the case in paper and the MTGO metagame was...constrained, I'll say. There was very low innovation incentive as everyone knew the metagame was temporary. Nadu also wasn't at its full potential as it had to play Thassa's Oracle thanks to the chess clock. We don't know what will happen now that Nadu's gone.
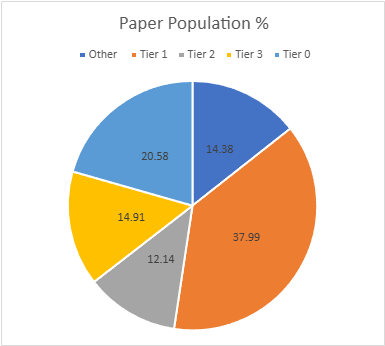
The Paper Population Data
Despite only having data through the 24th, August's population is the highest since February. RCQ season will do that, even when players are less enthusiastic than normal. January had 803 decks, February 890, March had 311, April hit 559, May fell to 389, June had 536, July rose to 589, and August hit 758. However, that's at the cost of diversity. August has 94 unique decks and a ratio of .124, considerably down from July's has 96 unique decks and a ratio of .163. Again, everyone knew Nadu was getting banned and so there's little reason to innovate. At least it's better than MTGO.
The population increase means that 24 decks made the tier list. The adjusted average population was 6.47, so 7 results make the list. The adjusted STDev was 11.32, so the increment is 12. Therefore, Tier 3 runs from 7 to 19, Tier 2 is 20 to 32, and Tier 1 is 33 and over.
August Power Metagame
Tracking the metagame in terms of population is standard practice. But how do results actually factor in? Better decks should also have better results. In an effort to measure this, I use a power ranking system in addition to the prevalence list. By doing so, I measure the relative strengths of each deck within the metagame so that a deck that just squeaks into Top 32 isn't valued the same as one that Top 8's. This better reflects metagame potential.
For the MTGO data, points are awarded based on the population of the event. Preliminaries award points based on record (1 for 3 wins, 2 for 4 wins, 3 for 5), and Challenges are scored 3 points for the Top 8, 2 for Top 16, and 1 for Top 32. If I can find them, non-Wizards events will be awarded points the same as Challenges or Preliminaries depending on what the event in question reports/behaves like. Super Qualifiers and similar higher-level events get an extra point and so do other events if they’re over 200 players, with a fifth point for going over 400 players.
Due to paper reporting being inconsistent and frequently full of data gaps compared to MTGO, its points work differently. I award points based on the size of the tournament rather than placement. For events with no reported starting population or up to 32 players, one point is awarded to every deck. Events with 33 players up to 128 players get two points. From 129 players up to 512 players get three. Above 512 is four points, and five points is reserved for Modern Pro Tours. When paper reports more than the Top 8, which is rare, I take all the decks with a winning record or tied for Top 32, whichever is pertinent.
The MTGO Power Tiers
As with the population numbers, total points are down from 2856 to 2190. The adjusted average points were 20.72, therefore 21 points made Tier 3. The STDev was 38.96, so add 39 to the starting point, and Tier 3 runs to 60 points. Tier 2 starts with 61 points and runs to 100. Tier 1 requires at least 101 points. There's some movement in the upper tiers and Lotus Field joined the tier list.
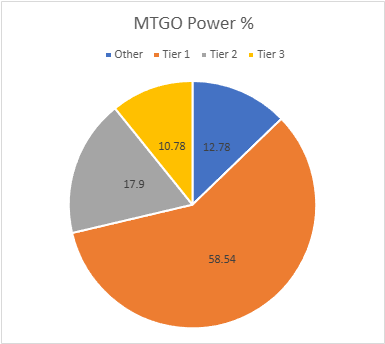
The new Lotus Field combo deck is the perfect encapsulation of the specialist effect. There are only three players actually putting up results with it, but they're so dedicated that they've accrued 22 points on 9 appearances. I have no idea if that kind of success is replicable, and suspect that they're getting away with players being unfamiliar with their deck. However, it is still an impressive result.
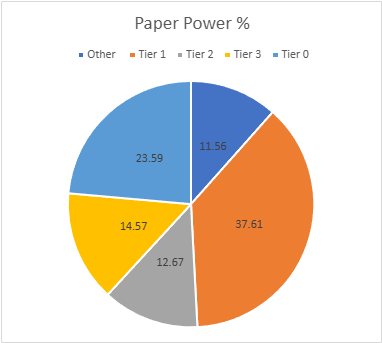
The Paper Power Tiers
Paper's total points are up in August, 1263 to 984. There were a lot of events in August, including a number of 3 pointers. The adjusted average points were 10.37, setting the cutoff at 11 points. The STDev was 19.09, thus add 19 to the starting point and Tier 3 runs to 30 points. Tier 2 starts with 31 points and runs to 50. Tier 1 requires at least 51 points. While there's some movement inside the tiers, they're ultimately unchanged.
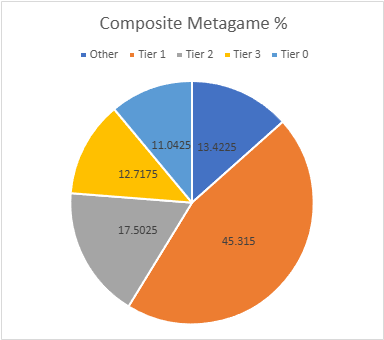
Composite Metagame
That's a lot of data, but what does it all mean? When Modern Nexus was first started, we had a statistical method to combine the MTGO and paper data, but the math of that system doesn't work without big paper events. I tried. Instead, I'm using an averaging system to combine the data. I take the MTGO results and average the tier, then separately average the paper results, then average the paper and MTGO results together for final tier placement.
This generates a lot of partial Tiers. That's not a bug, but a feature. The nuance separates the solidly Tiered decks from the more flexible ones and shows the true relative power differences between the decks. Every deck in the paper and MTGO results is on the table, and when they don't appear in a given category, they're marked N/A. This is treated as a 4 for averaging purposes.
Average Power Rankings
Finally, we come to the average power rankings. These are found by taking the total points earned and dividing them by total decks, to measure points per deck. I use this to measure strength vs. popularity. Measuring deck strength is hard. There is no Wins-Above-Replacement metric for Magic, and I'm not certain that one could be credibly devised. The game is too complex, and even then, power is very contextual.
Using the power rankings helps to show how justified a deck’s popularity is. However, more popular decks will still necessarily earn a lot of points. Therefore, the top tier doesn't move much between population and power and obscures whether its decks really earned their position.
This is where the averaging comes in. Decks that earn a lot of points because they get a lot of results will do worse than decks that win more events, indicating which deck actually performs better.
A higher average indicates lots of high finishes, whereas low averages result from mediocre performances and a high population. Lower-tier decks typically do very well here, likely due to their pilots being enthusiasts. Bear this in mind and be careful about reading too much into these results. However, as a general rule, decks that place above the baseline average are over-performing, and vice versa.
How far above or below that average a deck sits justifies its position on the power tiers. Decks well above baseline are undervalued, while decks well below baseline are very popular, but aren't necessarily good.
The Real Story
When considering the average points, the key is looking at how far off a deck is from the Baseline stat (the overall average of points/population). The closer a deck’s performance to the Baseline, the more likely it is to be performing close to its "true" potential.
A deck that is exactly average would therefore perform exactly as well as expected. The greater the deviation from the average, the more a deck under or over-performs. On the low end, a deck’s placing was mainly due to population rather than power, which suggests it’s overrated. A high-scoring deck is the opposite of this.
As Nadu is Tier 0 in paper, it's out of the running for Deck of the Month.
I'll begin with the averages for MTGO:
Not that Nadu's disqualification matters. RG Eldrazi ran away with the average points and wins MTGO Deck of August.
Now the paper averages:
As the top finishing Tier 1 deck, Jeskai Control is paper's Deck of August.
Analysis
The big story here is the ban. As expected, Nadu, Winged Wisdom has been banned. Well done, Wizards, you learned from Bridge from Below. I was right, the card was made with Commander in mind. However, I thought it was explicitly made for the Commander decks and jumped files at the last minute. I was wrong, it was just changed at the last second to be more appealing for Commander. Wizards, please finally learn to never release cards you haven't tested already. I thought Skullclamp was lesson enough, but evidently not.
What I didn't expect was for Grief to also get the ax. I had 50/50 odds of The One Ring going. They considered it, but they think The Ring is fun gameplay. Which is certainly an interesting peek inside their heads, and makes other decisions start to make more sense. I don't agree, but that doesn't matter to the ones making these decisions.
Instead, they decided to kill off Scamming. Which I get. It is aggressively unfun to lose two cards on turn 1 and then have to deal with a 4/3 menace. However, banning Grief now is really weird. While it appears in a number of decks, none of those are top tier decks. It strikes me as a decision they made right after the Pro Tour and just stuck with it, despite metagame changes.
Deck Adjustments
If only the Tier 0 deck was gone, Modern would have gone through a period of reshuffling rather than outright change. The rest of the decks aren't directly affected, but the maindeck and sideboard answer packages will be able to change away from anti-Nadu answers towards the rest of the metagame. Thus, the decks would reshuffle and adjust but the metagame wouldn't be fundamentally altered.
However, losing Grief is another story. It was an integral piece of both the Scam and non-Scam versions of Necro, as well as Goryo Blink and Living End. These decks will have to adapt. The Necro decks will have little trouble replacing Grief with additional copies of Thoughtseize or Inquisition of Kozilek. However, Living End is likely living over. It was still hanging on pre-ban, but was hardly thriving, surviving mostly off Grief and other free interaction. While it may be able to retool around Flare of Denial, I think Enders will need to seriously rethink their decks and I'm skeptical of it surviving.
Goryo is more complicated. It's the only deck with sustained success that casts Ephemerate on Grief. Remember how everyone feared that would be omnipresent in Modern? While Goryo hasn't lost its ability to quickly cheat in Atraxa, Grand Unifier, losing Grief removes its ability to proactively defend against counters and graveyard hate. It also pushes it more towards being a dedicated reanimator deck instead of the midrange/reanimator thing it had going. The deck should survive but will look and play differently.
Then there's the impact on all non-Grief decks. For the past two years, decks have been built with the knowledge that they could be Scammed, pushing them towards resiliency and robustness over sheer power. Now that the threat of a forced double mulligan is gone, this might push players to push their decks harder.
The New Modern
While it's impossible to tell what exactly will happen, I firmly believe that by September the questions around The One Ring will be answered. I can't foresee a reason for it to lose metagame share. It was already at 30-40% metagame saturation (depending on your source), mostly off control and Tron decks. At FNM last week, Boros Energy dropped one turn 2 off Amped Raptor on me. It's extremely concerning when an ostensibly aggro deck is playing an ostensibly control card.
The energy decks were thriving off of racing Nadu before the ban. They're answered neatly by sweepers, but most sweepers weren't good enough in a Nadu metagame. More of them can be played, but if Boros fully throws in with the Ring, then attrition becomes a less viable option. On the other hand, it also loses a lot of its aggro punch by playing such a card. Thus, in the near future energy is the presumed deck to beat, but that could quickly change. I suspect that MTGO assume it is and stop there, though paper may show more innovation.
Financial Implications
Banning fears put downward pressure on The One Ring's price, but now that it's safe until December 16, the price is rising again. If you haven't sold them, I'd plan to hold until at least November. I have serious doubts of The Ring surviving December, so play them through the RCQ season then look to sell high.
With a horror-themed set coming out, there's considerable speculation surrounding Necrodominance on the assumption that there will be pushed black cards. I feel like many are reading too much into the set theme, but investing in Necro-adjacent cards is a solid bet in a vacuum.

