Are you a Quiet Speculation member?
If not, now is a perfect time to join up! Our powerful tools, breaking-news analysis, and exclusive Discord channel will make sure you stay up to date and ahead of the curve.
July's data is here. Unfortunately, it confirms what most of us feared in June's data. Nadu Breakfast is in fact as good as it appears. So good that I've finally had to define Tier 0. However, it's a bit more complex than previous Tier 0 metagames. Nadu is impressive, but there are a number of other decks to watch. It will be interesting to see what happens on August 26.
Missing Data Update
June's data hole has been resolved, but we still lack an official resolution. Daybreak started posting Magic Online (MTGO) results again on July 8, including everything that they'd skipped during the outage. However, they no longer post all the results. They're back to only releasing curated lists of League 5-0's and the Top 32 of Challenges, and they've stopped posting Preliminary results all together. They haven't said why to the best of my knowledge.
However, the actual reason is obvious. When any business suddenly ceases operations without explanation or communication, it's always due to some legal threat. Initially, I thought it could be a vulnerability exposed by their API, but the duration of the communication blackout is consistent with what would appear to be a lawsuit threat.
Given that Daybreak has clamped down on data releases, it's clear that for some reason, Hasbro's lawyers may have threatened threatened them and that this is the compromise reached. It's well known that Hasbro hates sharing data and Wizards believes that too much data causes formats to be solved too quickly, so it fits.
I'm feeling fortunate I never tried to incorporate all the data Daybreak was throwing around into these updates. It's have been a lot of effort thrown away. However, only having access to Challenge data will make future updates interesting. Preliminaries added a lot of flavor and texture to the data but Challenges were the meat, so we're losing some context and vision on Modern.
However, July's MTGO population is the highest I've had this year. There's give and take.
Tier 0 Defined
Nadu Breakfast has finally forced me to define Tier 0. I wasn't doing these stats during Eldrazi Winter or Hogaak Summer, and therefore couldn't compare their stats to anything I saw over the past three years. I always said I'd know it when I see it and cross the bridge when it came. We're over the bridge thanks to Nadu, so Nadu gets to define what it means to be Tier 0.
Based on Nadu's stats in mid-July, I define a Tier 0 deck thusly: A Tier 0 deck is a statistical outlier above the rest of Tier 1, and its average points are substantially above the rest of Tier 1. It has to be the top of the top decks and be doing much better than all of them. It doesn't matter if Tier 2 or 3 decks outperform the Tier 0 deck on average points, that's normal and expected. Tier 1 is what matters.
However, Nadu won't be listed as Tier 0 for the MTGO stats. It no longer meets the definition. What happened is that starting around July 20, Nadu started appearing more in the Top 32 than Top 16, which slowly dragged down its average points. At the same time, Jeskai Control started only appearing in the Top 16, pulling up its average. The two averages are now close enough that Nadu doesn't qualify as Tier 0 anymore. There's no contest in paper though.
Other Outliers
Nadu is joined as an outlier in both play mediums by Jeskai Control and Boros Energy. Necro Scam is also an outlier on MTGO. As always, outliers are removed from the statistical analysis though they're reported in their correct positions on the Tier Lists.
July Population Metagame
To make the tier list, a given deck has to beat the overall average population for the month. The average is my estimate for how many results a given deck "should" produce in a given month. To be considered a tiered deck, it must perform better than "good enough". Every deck that posts at least the average number of results is "good enough" and makes the tier list.
Then we go one standard deviation (STdev) above average to set the limit of Tier 3 and the cutoff for Tier 2. This mathematically defines Tier 3 as those decks clustered near the average. Tier 2 goes from the cutoff to the next standard deviation. These are decks that perform well above average. Tier 1 consists of those decks at least two standard deviations above the mean result, encompassing the truly exceptional performing decks.
The MTGO data nearly exclusively comes from official Preliminary and Challenge results. Leagues are excluded, as they add analytically useless bulk data to both the population and power tiers. The paper data comes from any source I can find, with all reported events being counted.
While the MTGO events report predictable numbers, paper events can report anything from only the winner to all the results. In the latter case, if match results aren't included, I'll take as much of the Top 32 as possible. If match results are reported, I'll take winning record up to Top 32, and then any additional decks tied with 32nd place, as tiebreakers are a magic most foul and black.
The MTGO Population Data
May's adjusted average population for MTGO was 8.33. I always round down if the decimal is less than .20. Tier 3, therefore, begins with decks posting 9 results. The adjusted STdev was 18.51, so add 19 and that means Tier 3 runs to 28 results. Again, it's the starting point to the cutoff, then the next whole number for the next Tier. Therefore Tier 2 starts with 29 results and runs to 48. Subsequently, to make Tier 1, 49 decks are required.
As mentioned, MTGO's population exploded in July. There are 1600 decks in the sample from 50 Challenges, the highest sample ever. The next closest was last January at 1400. I have no idea if this is a new normal or not. The number of unique decks rose to 111 but the unique deck ratio is a paltry 0.07, down from .16 in June. Lots of decks means more unique lists, but not proportionately. The number of tiered decks is 22, exactly the same as June's. There wasn't much reason to experiment in July.
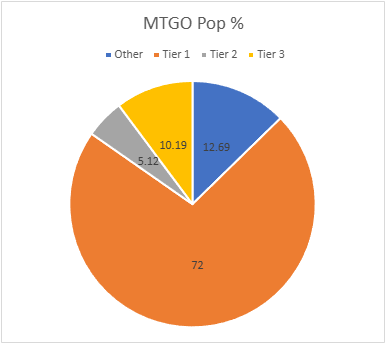
So, yeah. Nadu blasted everything else out of the water. Not even close.
That said, I think the thing to really focus on is all the energy decks. Jeskai Control only sort of counts as energy. Both the general purpose Boros and Mardu Energy decks made the tier list, but so did the more specialized Mardu Bombardment decks and Mono-Black Nightmare. Wizards wanted energy to be relevant again, and they've succeeded.
Meanwhile, some Yawgmoth decks remained virtually unchanged from pre-MH3 while some have embraced Birthing Ritual. The Ritual versions gradually gained ground over July and they're the only ones that made the tier list. Having played against it, I get why. Ritual is a much better value engine than Agatha's Soul Cauldron.
The Paper Population Data
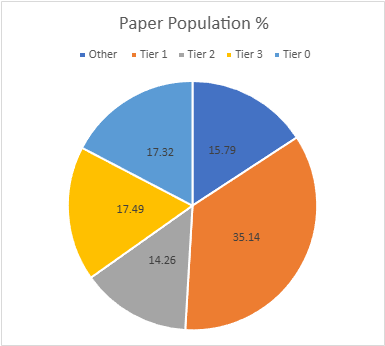
June had a solid paper population. January had 803 decks, February 890, March had 311, April hit 559, May fell to 389, June had 536, while July rose to 589. Paper's diversity is down slightly, though it's not as dramatic. July has 96 unique decks and a ratio of .163, while June had 97 decks and a ratio of .169. Statistically, diversity and population have not meaningfully changed.
The population increase means that 30 decks made the tier list. The adjusted average population was 4.15, so 4 results make the list. The adjusted STDev was 6.05, so the increment is 6. Therefore, Tier 3 runs from 4 to 10, Tier 2 is 11 to 17, and Tier 1 is 18 and over.
There are a lot of differences in deck positions between MTGO and paper, with Necro Scam not being an outlier being the most prominent. To go from outlier #3 to barely on Tier 1 is quite significant. There's also the fact that the Eldrazi decks all performed worse in paper than online. It's too early to tell if that means anything other beyond the fact that the player bases are so different. I know that the MTGO crowd were going nuts over a solved metagame only for it to not work as expected.
I'll take this opportunity to call out the Lotus Field deck. It making the Tier List is down to the work of three players on MTGO. Nobody else seems to be winning with this deck. Just the three. When I talk about specialists and the effect they have on the data, this is what I'm talking about.
July Power Metagame
Tracking the metagame in terms of population is standard practice. But how do results actually factor in? Better decks should also have better results. In an effort to measure this, I use a power ranking system in addition to the prevalence list. By doing so, I measure the relative strengths of each deck within the metagame so that a deck that just squeaks into Top 32 isn't valued the same as one that Top 8's. This better reflects metagame potential.
For the MTGO data, points are awarded based on the population of the event. Preliminaries award points based on record (1 for 3 wins, 2 for 4 wins, 3 for 5), and Challenges are scored 3 points for the Top 8, 2 for Top 16, and 1 for Top 32. If I can find them, non-Wizards events will be awarded points the same as Challenges or Preliminaries depending on what the event in question reports/behaves like. Super Qualifiers and similar higher-level events get an extra point and so do other events if they’re over 200 players, with a fifth point for going over 400 players.
Due to paper reporting being inconsistent and frequently full of data gaps compared to MTGO, its points work differently. I award points based on the size of the tournament rather than placement. For events with no reported starting population or up to 32 players, one point is awarded to every deck. Events with 33 players up to 128 players get two points. From 129 players up to 512 players get three. Above 512 is four points, and five points is reserved for Modern Pro Tours. When paper reports more than the Top 8, which is rare, I take all the decks with a winning record or tied for Top 32, whichever is pertinent.
The MTGO Power Tiers
As with the population numbers, total points are up, from 820 to 2856. The adjusted average points were 14.09, therefore 14 points made Tier 3. The STDev was 32.06, so add 32 to the starting point, and Tier 3 runs to 46 points. Tier 2 starts with 47 points and runs to 79. Tier 1 requires at least 80 points. Mono-Green Eldrazi (the non-Tron version) and UR Eldrazi joined the list.
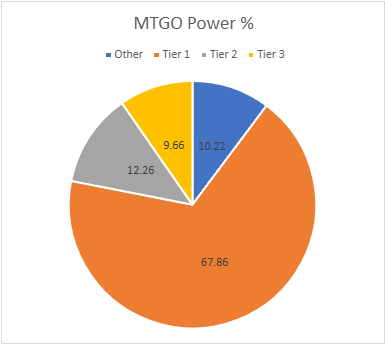
There's quite a lot of movement between and within the tiers. This will make perfect sense once we get to the average power.
The Paper Power Tiers
Paper's total points are actually down in July, 1256 to 984. There were more events in July, but none of them were a Pro Tour, which boosted June's points far above what they should have been. The adjusted average points were 6.54, setting the cutoff at 7 points. The STDev was 9.90, thus add 10 to the starting point and Tier 3 runs to 17 points. Tier 2 starts with 18 points and runs to 28. Tier 1 requires at least 29 points. The bottom four decks from the population tier fell off on power, as did Jeskai Wizards. Jeskai Combo Breach made the population tier in their place.
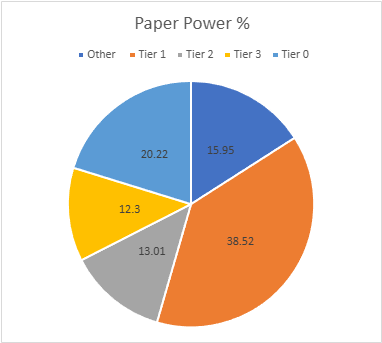
Again, there's a lot of dynamism in these tiers. The Tier 0 deck is quite oppressive, but not enough to prevent metagame dynamism beneath it. I assume that this is thanks to everyone assuming that it will be banned.
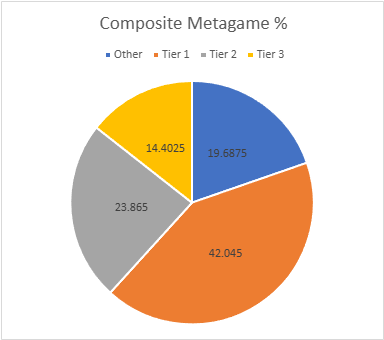
Composite Metagame
That's a lot of data, but what does it all mean? When Modern Nexus was first started, we had a statistical method to combine the MTGO and paper data, but the math of that system doesn't work without big paper events. I tried. Instead, I'm using an averaging system to combine the data. I take the MTGO results and average the tier, then separately average the paper results, then average the paper and MTGO results together for final tier placement.
This generates a lot of partial Tiers. That's not a bug, but a feature. The nuance separates the solidly Tiered decks from the more flexible ones and shows the true relative power differences between the decks. Every deck in the paper and MTGO results is on the table, and when they don't appear in a given category, they're marked N/A. This is treated as a 4 for averaging purposes.
Average Power Rankings
Finally, we come to the average power rankings. These are found by taking the total points earned and dividing them by total decks, to measure points per deck. I use this to measure strength vs. popularity. Measuring deck strength is hard. There is no Wins-Above-Replacement metric for Magic, and I'm not certain that one could be credibly devised. The game is too complex, and even then, power is very contextual.
Using the power rankings helps to show how justified a deck’s popularity is. However, more popular decks will still necessarily earn a lot of points. Therefore, the top tier doesn't move much between population and power and obscures whether its decks really earned their position.
This is where the averaging comes in. Decks that earn a lot of points because they get a lot of results will do worse than decks that win more events, indicating which deck actually performs better.
A higher average indicates lots of high finishes, whereas low averages result from mediocre performances and a high population. Lower-tier decks typically do very well here, likely due to their pilots being enthusiasts. Bear this in mind and be careful about reading too much into these results. However, as a general rule, decks that place above the baseline average are over-performing, and vice versa.
How far above or below that average a deck sits justifies its position on the power tiers. Decks well above baseline are undervalued, while decks well below baseline are very popular, but aren't necessarily good.
The Real Story
When considering the average points, the key is looking at how far off a deck is from the Baseline stat (the overall average of points/population). The closer a deck’s performance to the Baseline, the more likely it is to be performing close to its "true" potential.
A deck that is exactly average would therefore perform exactly as well as expected. The greater the deviation from the average, the more a deck under or over-performs. On the low end, a deck’s placing was mainly due to population rather than power, which suggests it’s overrated. A high-scoring deck is the opposite of this.
I'll begin with the averages for MTGO:
As Nadu is the top Tier 1 deck on MTGO, it would normally get Deck of the Month. However, as it's Tier 0 in paper, I'm disqualifying Nadu from the running in both mediums. Instead, Jeskai Control gets to be MTGO Deck of July.
Now the paper averages:
As the top finishing Tier 1 deck, Necro Scam is paper's Deck of July.
Analysis
Alright Nadu, time to be real with you. You're a Tier 0 deck. The early results from August indicate that will continue. Tier 0 decks that don't get answered get banned. Your days should be numbered. It is my firm and fervent hope that Wizards has learned from Bridge from Below and will just ban the problematic card. There's no universe where what Nadu does, even if all the combo enablers get banned. There are a lot of those, so it's quite unlikely that Wizards would ban many cards than just one. There's a reason the best card in Modern is so cheap; no thinks it will be legal after Wizards next Ban Day, August 26.
Cheap Energy
Assuming that Nadu does fully and completely die, what happens next? It's easy to assume that Jeskai and Necro will take over, but that's ignoring that both are reactive decks built with Nadu in mind. They may significantly change as the metagame changes post-Nadu and/or the metagame may make them significantly better or worse. That's the problem with reactive decks, you never know.
However, what I'm certain of is that the energy decks will remain a significant force. Guide of Souls into Amped Raptor and/or Ocelot Pride is too strong a start to just disappear. That's not a bad thing. It's been quite a while since go-wide, small-creature flood the board aggro was a major metagame force. The trend has been for burn spells and big creatures or disruption to carry aggro.
Additionally, energy decks aren't that hard to answer. Spot removal into sweeper still works really well against this style of deck. The fact that Pride floods the board with 1/1's makes Pyroclasm Modern playable for the first time in nearly 10 years. Additionally, none of the energy decks in paper or online were showing particularly high win rates, so I'm not worried if they do grow in popularity. If Wizards disagrees, it will most likely target Guide as it's the key to the engine.
More Bans Possible?
I know that players are generally frustrated with more than just Nadu. The One Ring and Grief are the usual targets for that frustration. I understand. I certainly wouldn't be sad to see either or both go. However, I do think it's unlikely to happen. I suspect that Wizards will find an excuse to avoid banning anything unrelated to Nadu this time around. It will be justified by saying that they don't know the real post-MH3 metagame and want to give that a chance to emerge before any additional changes.
Whether that's the correct move is a judgement call. I can't analyze player's fun. On the stats, Grief probably doesn't deserve a ban. The percentage of decks using Grief is fairly high, the odds of successfully Scamming it in have decreased. Very few decks are running more than one Feign Death effect anymore, so the most egregious use has fallen. The flip side of that is that Grief is being Ephemerated more than it used to be, though still not as much as everyone thought it'd be after MH2.
The Ring is trickier. It is currently the most played nonland card in Modern. By a wide margin. It is also one of the only reasons that slower decks are viable in the current metagame, and also the previous one. Removing The Ring would speed up a lot of games and force the slower decks to play interactive cards rather than getting to blank opposing turns while drawing cards. However, that may also be a death sentence in the face of energy decks.
Financial Implications
There have been two set releases since my last article, and because of Nadu and MH3 more generally, nothing's made much impact on Modern. However, everyone is holding their breath, waiting for August 26th. Therefore, I'd prepare to pick up cheaper staples now anticipating higher demand as players rebuild their decks or buy into new ones.
As a speculative venture, Dour Port-Mage has some promise. Players like to draw cards, and they're jonesing for another Up the Beanstalk-like engine. Given how hyped Aspiringspike is for the card, it wouldn't surprise me to see considerable brewing happening around it, so I'd pick it up while it's still cheap before it becomes Suncleanser.

