Are you a Quiet Speculation member?
If not, now is a perfect time to join up! Our powerful tools, breaking-news analysis, and exclusive Discord channel will make sure you stay up to date and ahead of the curve.
It's the first full month since the last ban and Modern has moved as expected. Magic Online (MTGO) has consolidated around its favored energy deck. Paper has taken a different route and the RCQ metagame looks far more dynamic. This should last through the end of the RCQ season in November, though I expect MTGO to exert more influence. On a more positive note, no deck fit the definition of Tier 0, so that era seems to be over.
The Expected Outliers
At the end of last month's update, I predicted that MTGO would decide on the best energy deck and warp the metagame around that deck. And it happened. My money was on the Mardu Bombardment variant winning, as I expected the additional removal to be critical. However, that didn't happen, and Boros Bombardment with The One Ring won by a lot. It is consequently an outlier.

Meanwhile in paper, Boros Bombardment and UB Murktide are tied for first and are both outliers. Murktide was actually beating everything else by a decent margin until the last weekend of September when Boros made a surge. I place the blame for that on recent MTGO results being overrun by Boros decks. It kinda worked out for them but dragged down their average points considerably.
As always, outliers are removed from the data analysis but are reported in their correct place on the Tier List.
September Population Metagame
To make the tier list, a given deck has to beat the overall average population for the month. The average is my estimate for how many results a given deck "should" produce in a given month. To be considered a tiered deck, it must perform better than "good enough". Every deck that posts at least the average number of results is "good enough" and makes the tier list.
Then we go one standard deviation (STdev) above average to set the limit of Tier 3 and the cutoff for Tier 2. This mathematically defines Tier 3 as those decks clustered near the average. Tier 2 goes from the cutoff to the next standard deviation. These are decks that perform well above average. Tier 1 consists of those decks at least two standard deviations above the mean result, encompassing the truly exceptional performing decks.

The MTGO data nearly exclusively comes from official Preliminary and Challenge results. Leagues are excluded, as they add analytically useless bulk data to both the population and power tiers. The paper data comes from any source I can find, with all reported events being counted.
While the MTGO events report predictable numbers, paper events can report anything from only the winner to all the results. In the latter case, if match results aren't included, I'll take as much of the Top 32 as possible. If match results are reported, I'll take winning record up to Top 32, and then any additional decks tied with 32nd place, as tiebreakers are a magic most foul and black.
The MTGO Population Data
September's adjusted average population for MTGO was 11.09. I always round down if the decimal is less than .20. Tier 3, therefore, begins with decks posting 11 results. The adjusted STdev was 21.83, so add 22 and that means Tier 3 runs to 33 results. Again, it's the starting point to the cutoff, then the next whole number for the next Tier. Therefore Tier 2 starts with 34 results and runs to 56. Subsequently, to make Tier 1, 57 decks are required.

The population stats are up, but not as far up as I expected. September's population is 1360, up from 1216 in August. There were a number of really small Challenges where I included only the Top 16 because the rest of the reported results didn't have a winning record, which I've never had to do before. That's a very bad sign. The number of unique decks rose to 102, raising the unique deck ratio to 0.075, which is still really bad. The number of tiered decks marginally from 22 to 23. As usual, MTGO prefers established decks and optimization rather than experimentation.

I did separate out the energy decks based on card choices as much as possible for this update. I wanted to see which version did best, and the data has very clear answers, and it's consistent between paper and online. Therefore, I won't be doing that again for October. The best energy decks all play Goblin Bombardment, and Boros version need The Ring. Mardu is better off not playing The Ring, according to the data.
I'll take this opportunity to complain that Domain Zoo is misnamed. It's a dump category for all the decks featuring full sets of Leyline of the Guildpact, Leyline Binding, Tribal Flames, Scion of Draco, and Territorial Kavu. Every other card is wildly variable. Some cling to the Counter Cat template, others are more midrange, and then there are the wildcards. It's not really Zoo anymore, but there's nothing else to call it. We need a better name.
The Paper Population Data
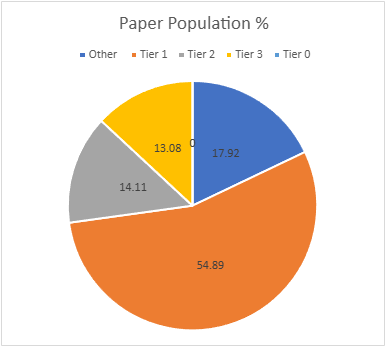
The RCQ season has brought paper's population heights usually only seen on MTGO. January had 803 decks, February 890, March had 311, April hit 559, May fell to 389, June had 536, July rose to 589, August hit 758, and September surged to 1155. Players turned out in force once Nadu was gone. However, diversity is relatively down despite being better than MTGO's. August had 94 unique decks and a ratio of .124, but September has 107 and a ratio of .093. I suspect that many RCQ players are taking the MTGO results as canon, forgetting that the online player base is tiny and its metagame is inbred.
The population increase means that 25 decks made the tier list. The adjusted average population was 8.45, so 7 results make the list. The adjusted STDev was 14.37, so the increment is 15. Therefore, Tier 3 runs from 9 to 24, Tier 2 is 25 to 40, and Tier 1 is 41 and over.
September Power Metagame
Tracking the metagame in terms of population is standard practice. But how do results actually factor in? Better decks should also have better results. In an effort to measure this, I use a power ranking system in addition to the prevalence list. By doing so, I measure the relative strengths of each deck within the metagame so that a deck that just squeaks into Top 32 isn't valued the same as one that Top 8's. This better reflects metagame potential.


For the MTGO data, points are awarded based on the population of the event. Preliminaries award points based on record (1 for 3 wins, 2 for 4 wins, 3 for 5), and Challenges are scored 3 points for the Top 8, 2 for Top 16, and 1 for Top 32. If I can find them, non-Wizards events will be awarded points the same as Challenges or Preliminaries depending on what the event in question reports/behaves like. Super Qualifiers and similar higher-level events get an extra point and so do other events if they’re over 200 players, with a fifth point for going over 400 players.
Due to paper reporting being inconsistent and frequently full of data gaps compared to MTGO, its points work differently. I award points based on the size of the tournament rather than placement. For events with no reported starting population or up to 32 players, one point is awarded to every deck. Events with 33 players up to 128 players get two points. From 129 players up to 512 players get three. Above 512 is four points, and five points is reserved for Modern Pro Tours. When paper reports more than the Top 8, which is rare, I take all the decks with a winning record or tied for Top 32, whichever is pertinent.
The MTGO Power Tiers
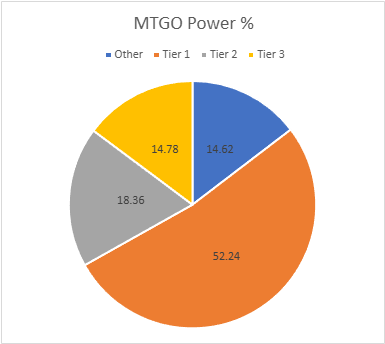
As with the population numbers, total points are up from 2190 to 2456. The adjusted average points were 19.85, therefore 20 points made Tier 3. The STDev was 40.13, so add 40 to the starting point, and Tier 3 runs to 60 points. Tier 2 starts with 61 points and runs to 101. Tier 1 requires at least 102 points. There's not much movement in the tiers though non-Ring Boros Bombardment fell off list.
The Paper Power Tiers
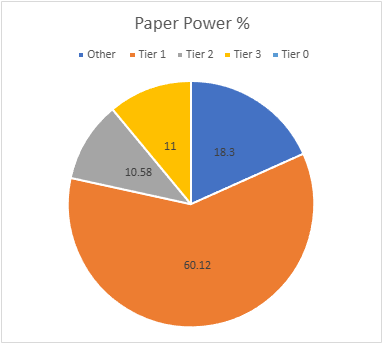
Paper's total points are up in September from 984 to 1863. There was a 4-point event for the first time in a while. The adjusted average points were 13.45, setting the cutoff at 14 points. The STDev was 23.37, thus add 24 to the starting point and Tier 3 runs to 38 points. Tier 2 starts with 39 points and runs to 63. Tier 1 requires at least 64 points. While there's some movement inside the tiers, they're ultimately unchanged.
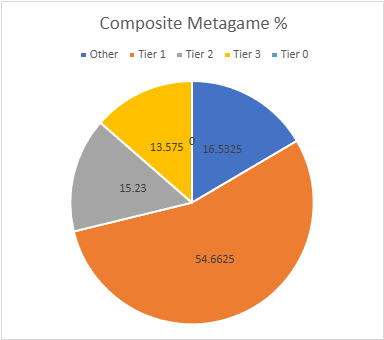
Composite Metagame
That's a lot of data, but what does it all mean? When Modern Nexus was first started, we had a statistical method to combine the MTGO and paper data, but the math of that system doesn't work without big paper events. I tried. Instead, I'm using an averaging system to combine the data. I take the MTGO results and average the tier, then separately average the paper results, then average the paper and MTGO results together for final tier placement.
This generates a lot of partial Tiers. That's not a bug, but a feature. The nuance separates the solidly Tiered decks from the more flexible ones and shows the true relative power differences between the decks. Every deck in the paper and MTGO results is on the table, and when they don't appear in a given category, they're marked N/A. This is treated as a 4 for averaging purposes.
Average Power Rankings
Finally, we come to the average power rankings. These are found by taking the total points earned and dividing them by total decks, to measure points per deck. I use this to measure strength vs. popularity. Measuring deck strength is hard. There is no Wins-Above-Replacement metric for Magic, and I'm not certain that one could be credibly devised. The game is too complex, and even then, power is very contextual.
Using the power rankings helps to show how justified a deck’s popularity is. However, more popular decks will still necessarily earn a lot of points. Therefore, the top tier doesn't move much between population and power and obscures whether its decks really earned their position.

This is where the averaging comes in. Decks that earn a lot of points because they get a lot of results will do worse than decks that win more events, indicating which deck actually performs better.
A higher average indicates lots of high finishes, whereas low averages result from mediocre performances and a high population. Lower-tier decks typically do very well here, likely due to their pilots being enthusiasts. Bear this in mind and be careful about reading too much into these results. However, as a general rule, decks that place above the baseline average are over-performing, and vice versa.
How far above or below that average a deck sits justifies its position on the power tiers. Decks well above baseline are undervalued, while decks well below baseline are very popular, but aren't necessarily good.
The Real Story
When considering the average points, the key is looking at how far off a deck is from the Baseline stat (the overall average of points/population). The closer a deck’s performance to the Baseline, the more likely it is to be performing close to its "true" potential.
A deck that is exactly average would therefore perform exactly as well as expected. The greater the deviation from the average, the more a deck under or over-performs. On the low end, a deck’s placing was mainly due to population rather than power, which suggests it’s overrated. A high-scoring deck is the opposite of this.
I'll begin with the averages for MTGO:
Mardu Bombardment wins MTGO Deck of September. It was actually ahead of Boros by a good margin early on, but around the middle of the month they stopped playing Mardu and switched to Boros. I have no idea why, Mardu was putting up really good results before it was unceremoniously dropped.
Now the paper averages:
Amulet Titan, the deck that will not die, wins Deck of September in paper. We're clearly not playing enough Harbinger of the Seas.
Analysis
The energy players did adopt The Ring, as I feared they would. It's only paying off in Boros Bombardment builds, but it is working well. This started the weekend before Ban Day, which is fortunate as I suspect that had it happened earlier it wouldn't have escaped being banned in August. As it is, per Wizards' policy it has until December. The Ring is now the most played card in Modern, including lands. That can't be acceptable much longer by itself, but the fact that an aggro deck is adopting it is decidedly bad.

However, the numbers don't tell the full story. The MTGO crowd appears to have adopted an "If you can't beat 'em, join 'em" attitude and have mass migrated towards Boros Energy and are focused on tuning it for the mirror. The Ring shines in the mirror, but since Energy rarely plays more than two, it's underwhelming in most other matchups.
I've been told, to my great surprise, that The Ring isn't actually very important against control decks. On paper, control should be able to crush Energy as the deck is incredibly weak to sweepers. However, Bombardment has changed the game. The strategy now plans to do as much early chip damage as possible, then burn the opponent out with Bombardment, Phlage, Titan of Fire's Fury, and Ajani, Nacatl Pariah // Ajani, Nacatl Avenger. The game is increasingly about keeping the reach off the table.
Control's Problem
This plan is hardly foolproof, but Jeskai Control isn't doing itself any favors. Until very recently, it was far more vulnerable to Suncleanser than Energy itself. As the only way to remove it if it slipped past counterspells was a singleton Supreme Verdict. It also struggled to close games because its only finisher was Phlage. It handily dominated game 1, but if the opponent brought in graveyard hate Jeskai frequently couldn't win. Pilots are finally fixing these weaknesses by playing more evoke elementals, but it hasn't reversed Jeskai's decline.

The problem is that Energy's central plan is deceptive. Going after the creatures is good, but it's far more important to go after the reach cards. Rather than just sideboarding in Pyroclasm, players should have that plus something for Phlage while holding counters for Bombardment. The pressure from the creatures usually tricks players into thinking they're more important, and Energy is skating by on the misconception.
UB Murktide doesn't have these problems. It can kill from nowhere thanks to Psychic Frog and there's no silver bullet against it. The paper players are embracing this and tuning their sideboards against Energy far more effectively than the online players.
Adaptations
Players are trying to adapt, but it's been an uneven process. On paper, Solemnity blanks energy, The One Ring, Murktide Regent and Frog. Most of the metagame, in short. However, there's no deck out there that runs it because it's fairly dead otherwise. The various combos that have been tried with it just don't work. I've seen a lot of chatter about players trying to make it work, but so far, it's gone nowhere.

Going over Energy is working much better. Energy decks are built more to grind opponents out than to blitz wins. They certainly can win quickly, but it's not reliable. Their sideboard options against non-creature spells are fairly limited as well. Consequently, combo decks of all types are making a comeback. Ruby Storm was already a fine deck, but we're seeing more Belcher decks too. Combo's goldfish speed is slightly faster than Energy's, and the very specific hate needed to fight combo is often lacking from Boros Energy. Mardu is better positioned, so perhaps a rise in combo will shift focus away from Boros.
Financial Implications
If you're holding The One Ring, I would advise selling before the end of RCQ season. Demand and therefore price will fall naturally by November, and since most expect Wizards to ban the Ring in December, I suspect the price will begin to rapidly decline. I'd get out while the getting's good.

On the buying side, Fear of Missing Out has generated a new Delirium-centric deck. I have doubts about that particular deck's longevity, however, Magic players being how they are, I do expect FOMO itself to see considerable play long-term, if not in Modern then certainly in Standard and Pioneer. It's a velocity card that generates new attack steps, so it will always be brewed around. I expect it to hold value for the foreseeable future, and might see a gradual increase.

