Are you a Quiet Speculation member?
If not, now is a perfect time to join up! Our powerful tools, breaking-news analysis, and exclusive Discord channel will make sure you stay up to date and ahead of the curve.
February saw the first Modern Regional Qualifiers and Showcase Challenges of 2025. Consequently, the data set is quite large, but simultaneously it feels quite narrow. That'll happen when players are certain there are a small number of viable decks. The data both questions and supports that conclusion.
The Outliers
As has become custom, there are statistical outliers in the data. It's quite rare to not have at least one in both mediums, to be fair. However, having a lot is also rare, but that's where MTGO ended up in February. The top four decks were very conclusively outliers, to the point that if I didn't remove them then they'd be the only Tier 1 decks and Tier 2 would not exist. That's how vast the gap is. Removing them allows me to present a more normal-looking Tier List.
Meanwhile, paper only has one outlier, Temur Breach Combo. The next three decks were on the borderline, as some tests picked them as outliers and some didn't. When this happens, I always default to the outlier that all tests agree on. Additionally, removing just Temur Breach made the data look more normal than removing all four. That sounds weird but it's true, the Tier List would have looked far stranger than it currently does.
As always, outliers are removed from the statistical analysis but are reported in their correct position on the Tier List.
February Population Metagame
To make the tier list, a given deck has to beat the overall average population for the month. The average is my estimate for how many results a given deck "should" produce in a given month. To be considered a tiered deck, it must perform better than "good enough". Every deck that posts at least the average number of results is "good enough" and makes the tier list.
Then we go one standard deviation (STdev) above average to set the limit of Tier 3 and the cutoff for Tier 2. This mathematically defines Tier 3 as those decks clustered near the average. Tier 2 goes from the cutoff to the next standard deviation. These are decks that perform well above average. Tier 1 consists of those decks at least two standard deviations above the mean result, encompassing the truly exceptional performing decks.
The MTGO data nearly exclusively comes from official Preliminary and Challenge results. Leagues are excluded, as they add analytically useless bulk data to both the population and power tiers. The paper data comes from any source I can find, with all reported events being counted.
While the MTGO events report predictable numbers, paper events can report anything from only the winner to all the results. In the latter case, if match results aren't included, I'll take as much of the Top 32 as possible. If match results are reported, I'll take winning record up to Top 32, and then any additional decks tied with 32nd place, as tiebreakers are a magic most foul and black.
The MTGO Population Data
February's's adjusted average population for MTGO is 8.02. I always round down if the decimal is less than .20. Tier 3, therefore, begins with decks posting 8 results. The adjusted STdev was 12.03, so add 12 and that means Tier 3 runs to 20 results. Again, it's the starting point to the cutoff, then the next whole number for the next Tier. Therefore Tier 2 starts with 21 results and runs to 33. Subsequently, to make Tier 1, 34 decks are required.
The sample population always falls in February because it's a shorter month. I recorded 1472 decks, down from 1600 in January but still quite high compared to 2024's averages. I have 96 unique decks in my sample, which equates to a unique deck ratio of .065, which is better than January's .061 but still isn't good compared to 2024's average of 0.70. 29 decks made the tier list, mostly thanks to all the outliers I removed.
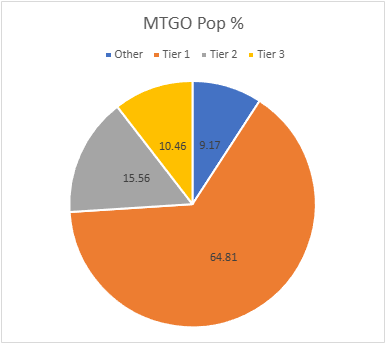
The MTGO grinders have clearly concluded that there are only four good decks in Modern (Boros Energy, BW Blink, Base-Green Eldrazi, and Temur Breach Combo) plus some also-rans. Stick a pin in that, we'll be revisiting that conclusion down the line as the data doesn't fully support that conclusion. Also, Ketramose, the New Dawn is everywhere. I'll be talking more about that down in the analysis section.
The most interesting development is that Abhorrent Frogtide has been falling off and increasingly replaced by regular old 2024 Frogtide. While the growing prevalence of graveyard hate in response to Breach's success is a factor, cheating in Abhorrent Oculus via Unearth is a potent but wildly inconsistent. Earlier versions of the deck lived and died on consistency, but Oculus incentivized them to try to spike wins with higher variance play. The metrics show it hasn't been working, and now Psychic Frog decks are reverting to form. Psychic Frog isn't a deck but a way of life and so it will remain a player in Modern. However, I think there's going to be a lot more turmoil in those lists in March.
The Paper Population Data
Meanwhile in paper the population continues to rise from 689 decks in January to 737. The massive Portland RC was the headline event, but there were a number of large events which drove up the population. 89 unique decks made the list for a ratio of .121. While much better than any ratio from MTGO, that's a really low number for paper. The RC players are on the same wavelength as MTGO when it comes to deck choice.
20 decks made the tier list, which is on the low end for paper. The adjusted average population is 7.20, so 7 results make the list. The adjusted STDev was 15.01, so the increment is 15. Therefore, Tier 3 runs from 7 to 22, Tier 2 is 23 to 38, and Tier 1 is 39 and over.
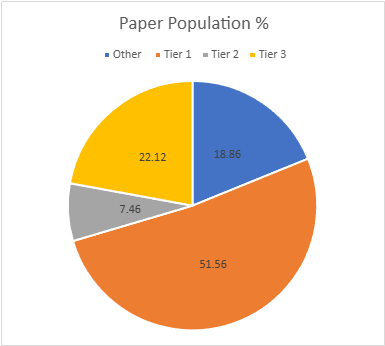
Energy continues to suffer in paper relative to what happens online. It feels like online Energy is a default deck for players rather than a purposeful choice, which keeps its numbers up. That isn't true in paper, and if it weren't for the numbers from the RC, I don't think it'd even be Tier 1 anymore. This is definitely something to watch during March.
February Power Metagame
Tracking the metagame in terms of population is standard practice. But how do results actually factor in? Better decks should also have better results. In an effort to measure this, I use a power ranking system in addition to the prevalence list. By doing so, I measure the relative strengths of each deck within the metagame so that a deck that just squeaks into Top 32 isn't valued the same as one that Top 8's. This better reflects metagame potential.
For the MTGO data, points are awarded based on the population of the event. Preliminaries award points based on record (1 for 3 wins, 2 for 4 wins, 3 for 5) if they ever get posted again, and Challenges are scored 3 points for the Top 8, 2 for Top 16, and 1 for Top 32. If I can find them, non-Wizards events will be awarded points the same as Challenges or Preliminaries depending on what the event in question reports/behaves like. Super Qualifiers and similar higher-level events get an extra point and so do other events if they’re over 200 players, with a fifth point for going over 400 players.
Due to paper reporting being inconsistent and frequently full of data gaps compared to MTGO, its points work differently. I award points based on the size of the tournament rather than placement. For events with no reported starting population or up to 32 players, one point is awarded to every deck. Events with 33 players up to 128 players get two points. From 129 players up to 512 players get three. Above 512 is four points, and five points is reserved for Modern Pro Tours. When paper reports more than the Top 8, which is rare, I take all the decks with a winning record or tied for Top 32, whichever is pertinent.
The MTGO Power Tiers
As with the population numbers, total points are down slightly to 2608. The adjusted average points were 13.95, therefore 14 points made Tier 3. The STDev was 20.54, so add 21 to the starting point, and Tier 3 runs to 35 points. Tier 2 starts with 36 points and runs to 57. Tier 1 requires at least 58 points. While the Tiers reshuffled a bit, nothing new made it nor did any deck fall off.
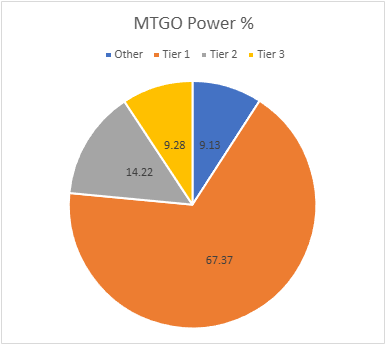
Thanks to some very strong players, Frogtide managed to make Tier 1, formally challenging Abhorrent versions. I suspect this will continue in March and they'll split the proverbial market. The myriad of other decks utilizing Frog for other purposes won't challenge the two big decks but will muddy the waters.
On that note, for reasons that I assume are Blink related, online Domain Zoo decks have latched onto Doorkeeper Thrull. It gets the benefit of dodging the evoke triggers on Phlage, Titan of Fire's Fury and Nulldrifter, but I can't imagine it was the primary intention. It shows up a bit in paper, but it's nowhere near as strong a trend. Thus, I suspect it's a direct result of the online metagame rather than being actually good.
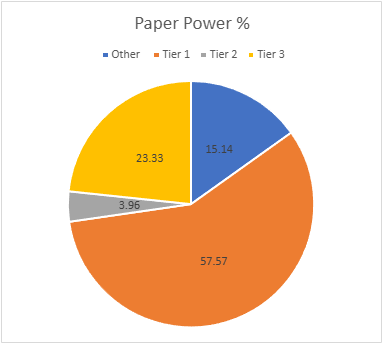
The Paper Power Tiers
Paper's total points are 1466. The adjusted average points were 13.75, setting the cutoff at 14 points. The STDev was 32.10, thus add 32 to the starting point and Tier 3 runs to 46 points. Tier 2 starts with 47 points and runs to 79. Tier 1 requires at least 80 points. The Kappa Cannoneer decks didn't make the cut.
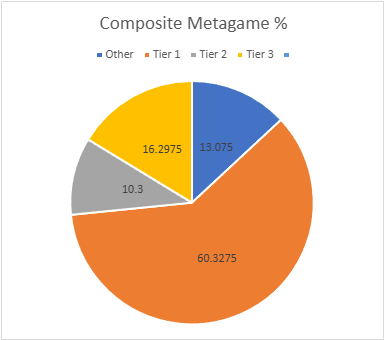
Composite Metagame
That's a lot of data, but what does it all mean? When Modern Nexus was first started, we had a statistical method to combine the MTGO and paper data, but the math of that system doesn't work without big paper events. I tried. Instead, I'm using an averaging system to combine the data. I take the MTGO results and average the tier, then separately average the paper results, then average the paper and MTGO results together for final tier placement.
This generates a lot of partial Tiers. That's not a bug, but a feature. The nuance separates the solidly Tiered decks from the more flexible ones and shows the true relative power differences between the decks. Every deck in the paper and MTGO results is on the table, and when they don't appear in a given category, they're marked N/A. This is treated as a 4 for averaging purposes.
Average Power Rankings
Finally, we come to the average power rankings. These are found by taking the total points earned and dividing them by total decks, to measure points per deck. I use this to measure strength vs. popularity. Measuring deck strength is hard. There is no Wins-Above-Replacement metric for Magic, and I'm not certain that one could be credibly devised. The game is too complex, and even then, power is very contextual.
Using the power rankings helps to show how justified a deck’s popularity is. However, more popular decks will still necessarily earn a lot of points. Therefore, the top tier doesn't move much between population and power and obscures whether its decks really earned their position.
This is where the averaging comes in. Decks that earn a lot of points because they get a lot of results will do worse than decks that win more events, indicating which deck actually performs better.
A higher average indicates lots of high finishes, whereas low averages result from mediocre performances and a high population. Lower-tier decks typically do very well here, likely due to their pilots being enthusiasts. Bear this in mind and be careful about reading too much into these results. However, as a general rule, decks that place above the baseline average are over-performing, and vice versa.
How far above or below that average a deck sits justifies its position on the power tiers. Decks well above baseline are undervalued, while decks well below baseline are very popular, but aren't necessarily good.
The Real Story
When considering the average points, the key is looking at how far off a deck is from the Baseline stat (the overall average of points/population). The closer a deck’s performance to the Baseline, the more likely it is to be performing close to its "true" potential.
A deck that is exactly average would therefore perform exactly as well as expected. The greater the deviation from the average, the more a deck under or over-performs. On the low end, a deck’s placing was mainly due to population rather than power, which suggests it’s overrated. A high-scoring deck is the opposite of this.
I'll begin with the averages for MTGO:
Temur Breach Combo is MTGO Deck of February for the second month running. It's a larger margin than in January, concerningly.
Now the paper averages:
Temur Breach also wins Paper Deck of January. It wasn't close. I'll discuss this in the next section.
Analysis
I need to lead off this section with a disclaimer: I have serious doubts about the reliability of February's MTGO results. I realize I'm down on MTGO a lot, but MTGO had some serious bugs that might have impacted February's data. I'm told Consign to Memory has an ongoing problem with replicate not always working. Urza's Saga and Karn, the Great Creator were bugged at one point and there's been some serious lag problems. I don't know if or to what extent these problems (unique to online play) impacted the data but let this be a reminder of why paper's metagame is a more reliable measure.
In fact, I suspect though cannot prove that lag is responsible for Boros Energy remaining the most played deck online. Energy requires fewer clicks than a deck like Breach, so when the servers are overloaded, it's more likely your commands will go through in timely fashion, saving you from timing out. It would also explain why Breach doesn't tend to show up outside of the largest Challenges or Showcases.
A History of Breaching
On that note, Temur Breach, specifically the version that wins via Thassa's Oracle, had the best average points in both play mediums. Its winrate appears to be quite high, though we don't have the "true" winrate available. I can't deny that Breach's popularity has exploded and is performing well above its norms. However, for many players the past two months have confirmed their beliefs about the deck in general and Underworld Breach specifically.
As a reminder, this is not the first time we've seen Breach Combo decks. Underworld Breach Combo first appeared at the end of 2022. Its Jeskai variant was the most successful, but it was still only a Tier 2 or lower deck. It only cracked my Tier 1 in December 2022, and that was only because I removed three outliers from the MTGO data. It declined over 2023 until its last appearance in August. It didn't reappear until September 2024 when Malevolent Rumble revived the archetype in Temur colors. However, it was still a Tier 2 or lower deck until Mox Opal transformed the deck.
Breaching the Question
However, to hear players discuss this deck, you'd think that it was ravaging Modern forever, and that Breach is, was, and has always been horribly broken in Modern. It's not true, but I get it. Breach is more versatile than Yawgmoth's Will, it's been banned in Legacy and Pioneer, and it feels really bad to lose to the deck. You just have to sit there and watch them go off. That's the sort of thing that really sticks in players' craw and lingers in the Magic cultural zeitgeist because human psychology tends to fixate on bad experiences. Despite the fact that it was never a big deal by the numbers, many remember it as being a huge problem with an outsized presence, which just makes its recent success the more galling. I get it.
To be perfectly clear, the past two months are the first time that reality has backed the perception. According to the data, Temur Breach Combo is the best performing deck in Modern, and it really isn't close. Naturally, this is leading to ban speculation surrounding Breach, far more and far more justified than normal. And I do agree, it looks like something from Breach Combo needs to be banned and it will almost certainly be Underworld.
However, this isn't Breach's fault. It's Opal's fault. Again, go back through the data. Prior to Opal's unban, Underworld Breach was in Breach Combo and sometimes Prowess, though usually only as a 1- or 2-of. Both have disappeared for long stretches and weren't that threatening on their own merits. The timeline is unequivocal that Breach only became a problem once Opal returned. However, there's no chance that Wizards rebans Opal this quickly. Consequently, I think Breach will be the first card sacrificed on Opal's alter. It won't be the last.
Ketramost
The other major story is Ketramose. He's everywhere. The obvious home was WB Blink, and Ketramose has almost taken Recruiter of the Guard's slot. What I didn't expect was for other decks to adopt him too. While frequently paired with Psychic Frog, it's also semi-successfully revived Necrodominance. However, I've seen players shoehorn him into Zoo, Energy, Mill, and Goryo's Vengeance decks just because they can. He's everywhere.
That doesn't necessarily mean he's good. BW rose in the rankings during February, but its average points fell. It was actually dramatically overperforming early on, but gradually began falling after Ketramose came out. That may be because it was more widely adopted, which dragged its average points down. That said, all the decks running Ketramose are so new that it's impossible to evaluate their trendlines. We'll see what happens in March.
Higher Highs, Lower Lows
I will say this: I don't think Ketramose has improved BW Blink by much, if at all. My experience so far is that Ketramose accentuates Blink's best and worst features. Since it first emerged, BW Blink has been a very slow midrange deck with a tendency to do nothing for the first few turns. It will grind out every other fair deck if it gets its engines going, but unless it can Solitude repeatedly it gets overwhelmed. Most of its cards are underpowered, so Blink has to play a lot of them to win against more powerful decks. It lives or dies on living long enough to get the engines going.
Ketramose doesn't do anything on its own. It's rare for Ketramose to be able to attack before turn 5, even with a turn 1 Relic of Progenitus. This is the same issue Overlord of the Balemurk has. It wants to be played early, but it doesn't do anything without an early Flickerwisp or Phelia, Exuberant Shepard. Getting the engine cards down is easy, but actually getting the engines running is hard and often slow.
When it comes together correctly the two engines hum in harmony and drive the deck forward with a tidal wave of creatures. When it doesn't, the deck just sits there and dies. Ketramose accentuates both possibilities. At least Recruiter could block on turn 3. Thus, I think Ketramose's impact on Blink has been neutral. If I'm wrong, there are a lot of players on Blink at my LGS to prove it.
Financial Implications
If you're holding Breach, I'd sell out quickly.
It's extremely unlikely that March will contradict Breach Combo's trend from January and February. I don't think Breach should be the card that gets banned on March 31st, but if anything gets banned it will be Breach. I'll be able to comment on that next update.
Elsewhere, Energy is on a general decline, particularly the Mardu variant. I'd look for opportunities to sell out of staples as I expect players to move away and prices to fall.
Interestingly, UW Miracles is making some noise. There's weak upward pressure on the prices of its planeswalkers and creatures, and should the deck prove more than a meme, that pressure should strengthen into a trend. Therefore, this is a solid speculative opportunity as those same cards have a strong price floor due to price memory and Commander.

